Network Visualisation
Complex information is easier to interpret, communicate and discuss if visualised. In the case of relational data (i.e., connections between objects—in the form of 'networks' or 'graphs') visualisation can support the identification of typical or unexpected patterns, complex paths and communities. If the network changes over time (a dynamic network), visualisation is crucial for understanding changes in the graph's structure, trajectories, how objects shift roles or move between communities in the graph, as well as for understanding anticipated future changes.
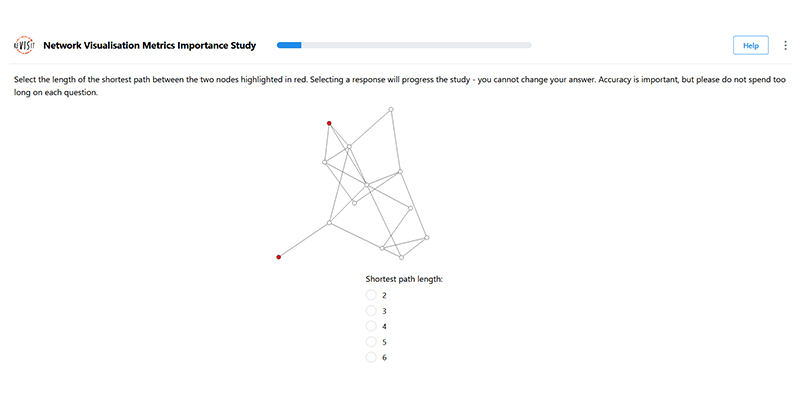
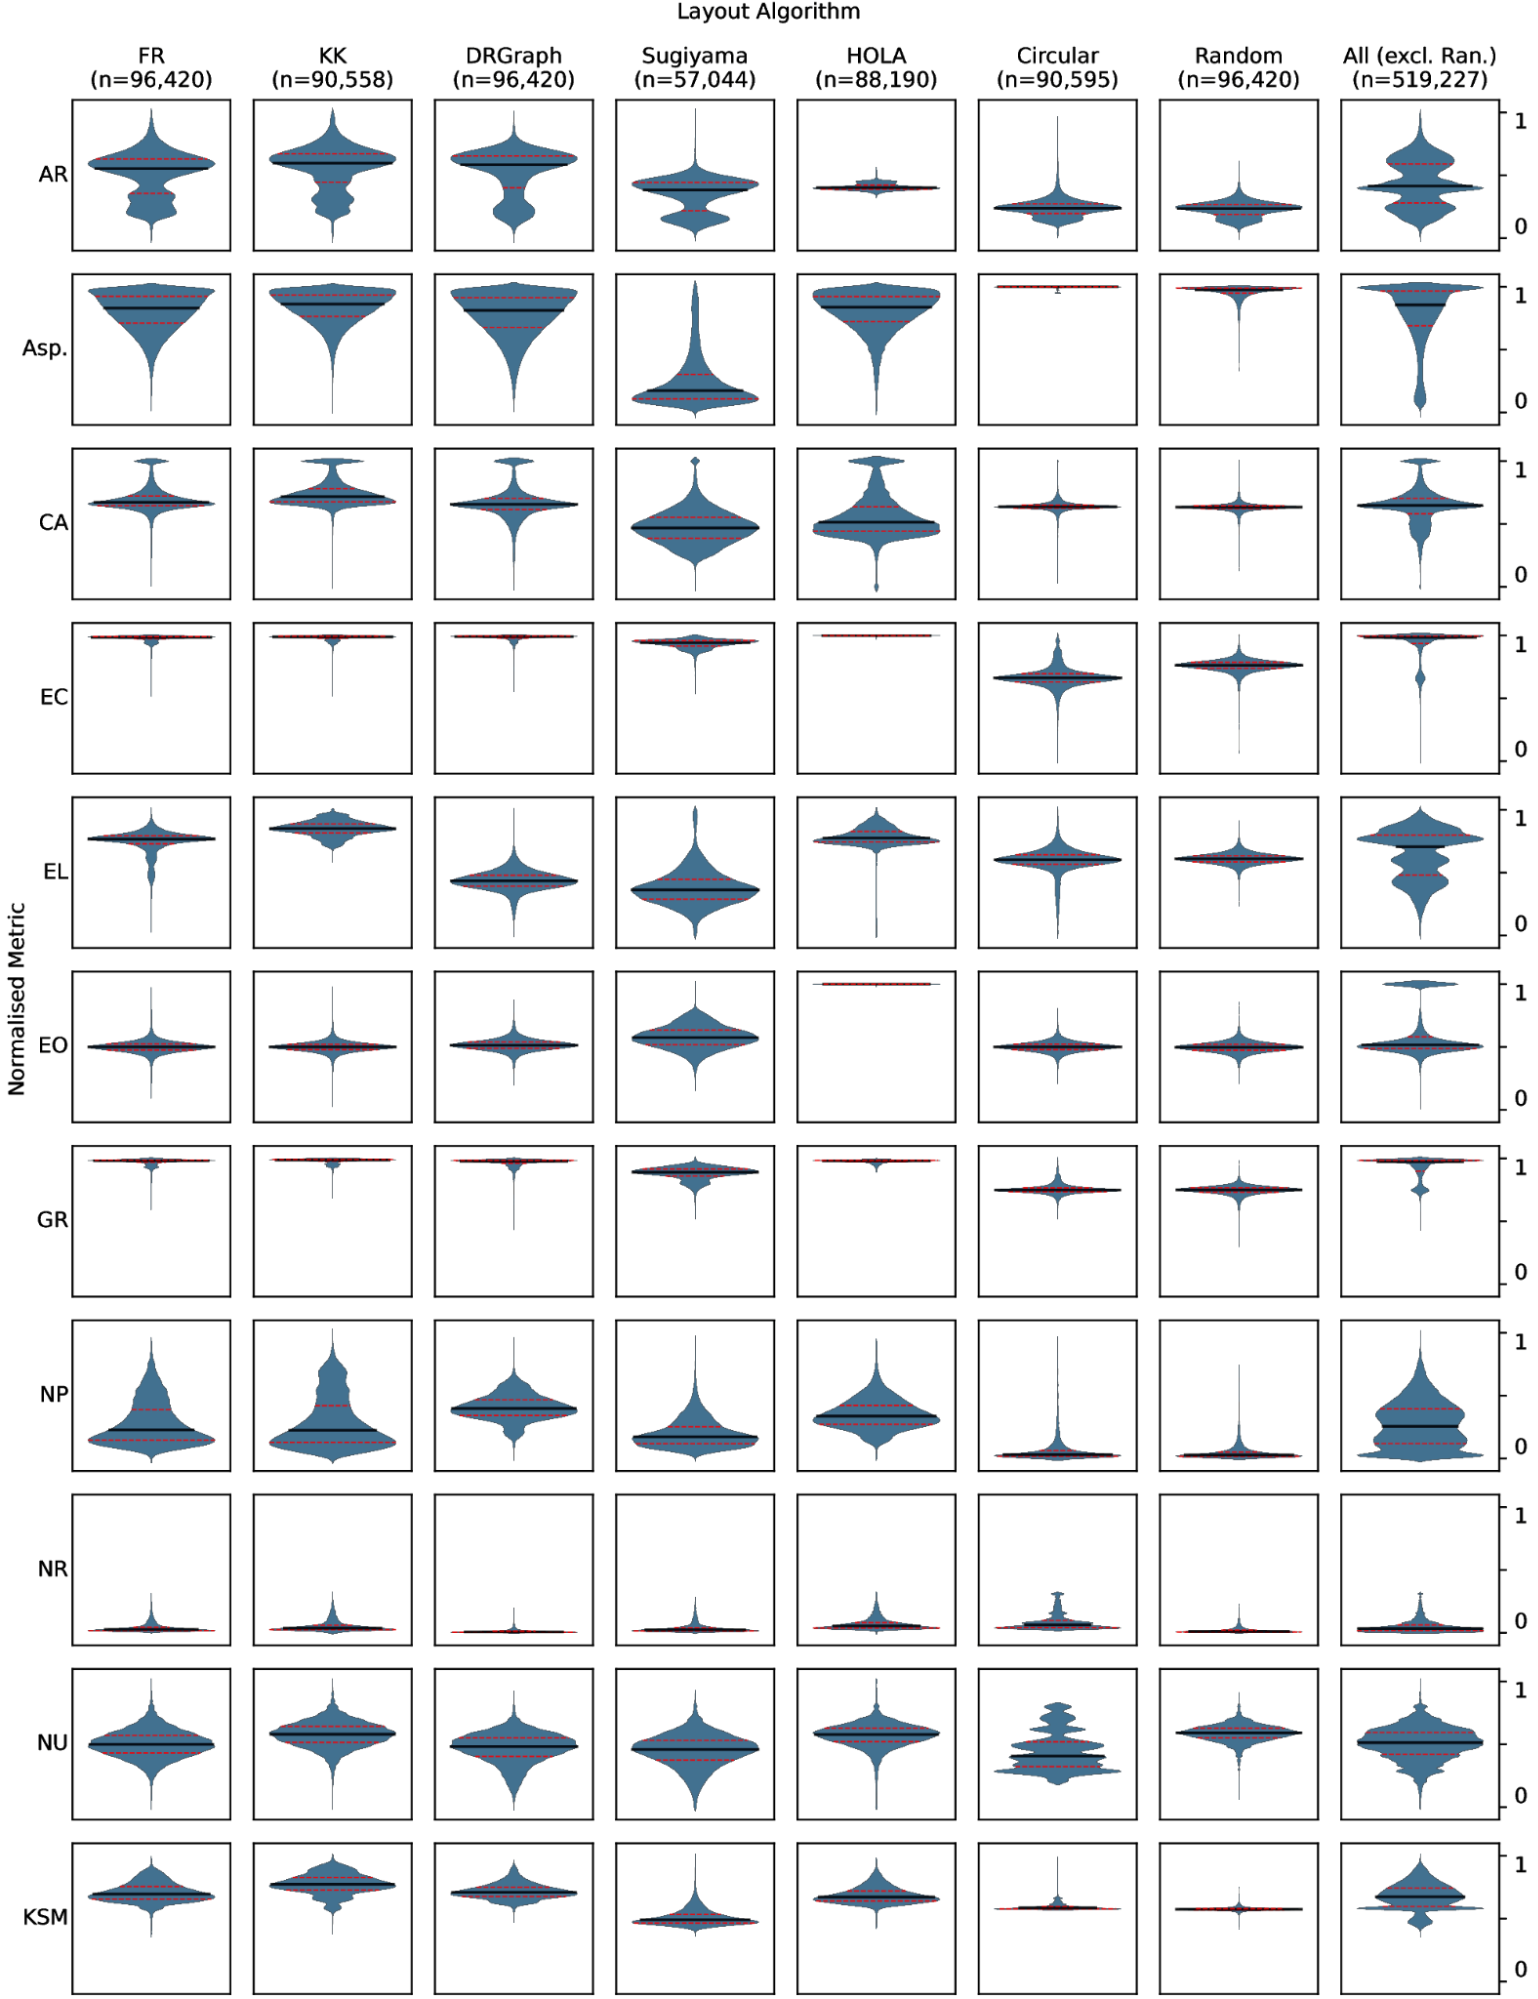
A large focus of the research done so far is centered around the effective evaluation of network visualisations from both a computational and human perspective for small and sparse networks. We design and implement a suite of 11 metrics to evaluate visual properties of network visualisations, such as the number of edge crossings. We explore this multi-dimensional landscape of network visualisation metrics to understand their computational limitations (e.g. range) and the relationships between metrics. Empirical human-centered experiments indicate which visual properties are most important for understanding and inform on algorithm design for both evaluating and producing network visualisations.
Extending our current research to large dynamic networks, we take a human-centered empirical approach, conducting experiments to determine the most effective means of visualising these larger networks which change over time. We also employ machine learning and XAI techniques to predict and explain events in dynamic networks, creating effective visualisations to better understand the network and predictions, and support decision making. We first focus on the domain of criminal communication networks and crime prevention, aiming to generalise and expand to other domains such as neuroimaging and epidemiology.
Impact
Outcomes of this project include: (1) effective visualisation of communication networks used in crime prevention; (2) a visual means for supporting decision-making based on trustworthy predictions; (3) dynamic graph visualisation, prediction and explanation techniques applicable to (at least) two other real-world domains.