Body Composition Analysis
At the Monash Metabolic Phenotyping Platform, users have the option of measuring lean mass, fat mass, water content and bone density via our EchoMRITM 3-in-1 Body Compostion Analyzer, or our Lunar PIXImus X-Ray Densitometer.Body Composition Analysis
EchoMRITM 3-in-1
- Measures fat, lean, free water and total water mass in live animals weighing up to 100 grams.
- High throughput, with a scanning time of 0.5 - 3.2 minutes (depending on precision options) and no anaesthesia needed.
- Added benefit of three vertical bores, one for live mice up to 100 grams, one for organs or tissue samples up to 7 grams and one for biopsy samples up to 0.3 grams.
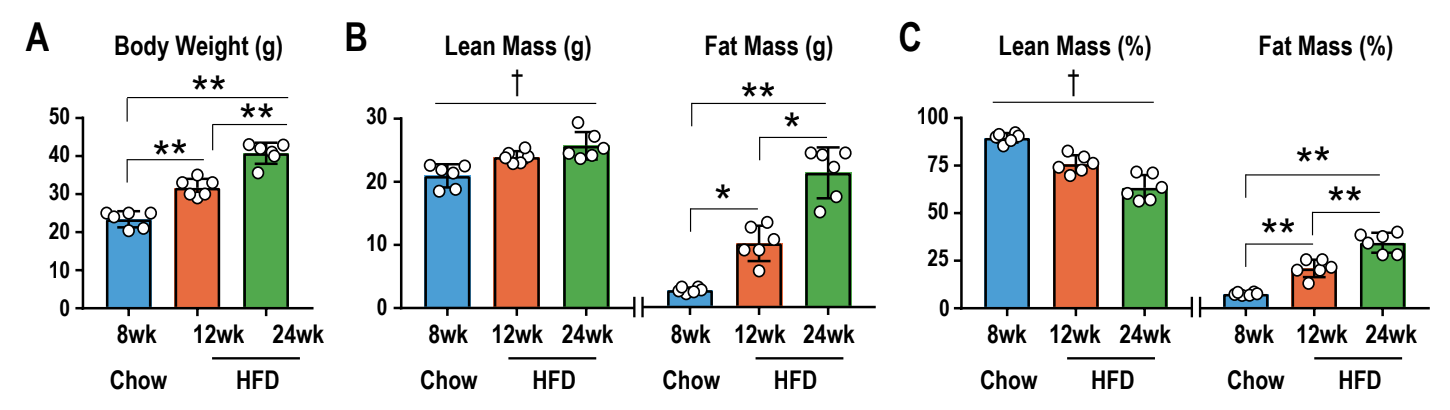
Real life data generated by the EchoMRITM 3-in-1 Body Composition Analyzer:
The graphs below compare total body weight (A), lean mass and fat mass (B), as well as lean and fat mass relative to body weight (C), in C57BL/6J mice. Mice (n=6) were fed a standard chow diet until 8 weeks of age and then changed to a diet high in fat (23.5% fat) until 24 weeks of age. Body composition was assessed at 8 weeks, 12 weeks and 24 weeks of age. It can be seen that mice progressively gain fat mass over the 16 week study period. Furthermore, whilst lean mass increases over time, when
expressed as percent body weight lean mass decreases. Data are presented as a scatter-plot (bars denote mean ± standard deviation). * p<0.01, **p<0.001 vs. corresponding group; † main effect for time, p<0.05.
Lunar PIXImus X-Ray Densitometer:
- Provides automated, accurate, and precise measurement of bone and tissue for small animals weighing 10-50 grams.
- Provides bone mineral and body composition results from total body imaging in less than 5 minutes.
- Allows the researcher to manually select regions of interest (e.g. spine or femur) within the total body image, producing bone and tissue data for the selected area.
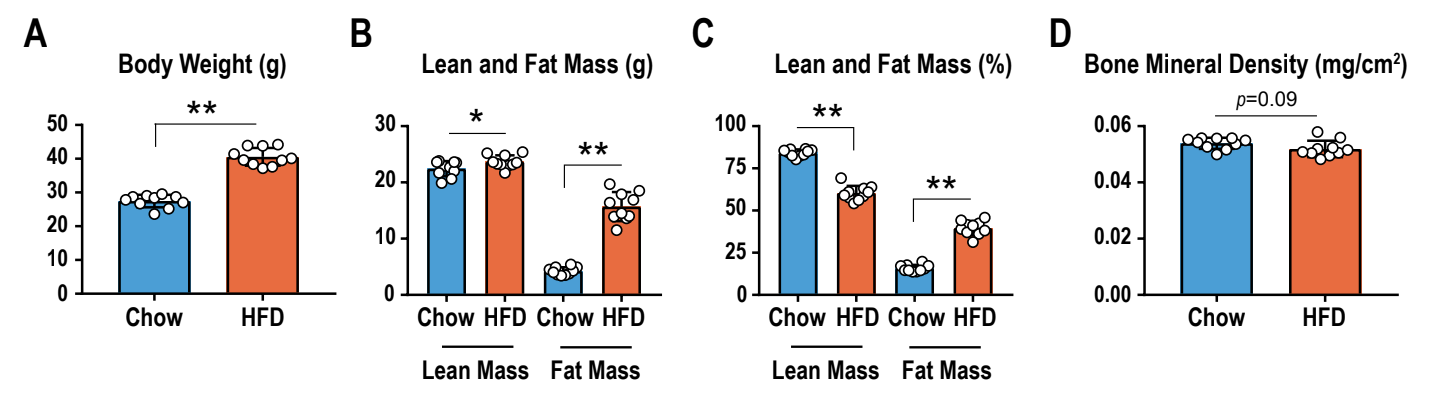
Real life data generated by the Lunar PIXImus X-Ray Densitometer:
The graphs below compare total body weight (A), lean mass and fat mass (B), lean and fat mass relative to body weight (C) and bone mineral density (D) in C57BL/6J mice fed a standard chow diet (n=10) or a high-fat diet (HFD) containing 23.5% fat (n=10). Mice were placed on the diet from weaning (3 weeks of age) until 15 weeks of age. Data are presented as a scatter plot (bars denote mean ± standard deviation). * p<0.05; **p<0.0001 vs. corresponding Chow group.