Food and Liquid Monitoring
The Monash Metabolic Phenotyping Platform houses a fully automated BioDAQ monitoring system for biological data acquisition. The BioDAQ’s flexible design allows the investigator to configure the animal’s cage to their specific study design. Our BioDAQ system allows for the following measurements:
- Food or liquid intake monitoring in up to 24 mice simultaneously.
- Food and liquid intake monitoring in up to 12 mice simultaneously.
Each cage is equipped with access gates, allowing the investigator to program the gate to open or close at a specified time and/or when a specified amount of food or liquid has been consumed.
Investigators receive a summary of data following the experiment. Where needed, additional analysis can be performed by our trained facility staff, adding a level of detail and sensitivity to your research project.
Real life data generated by the BioDAQ Monitoring System:
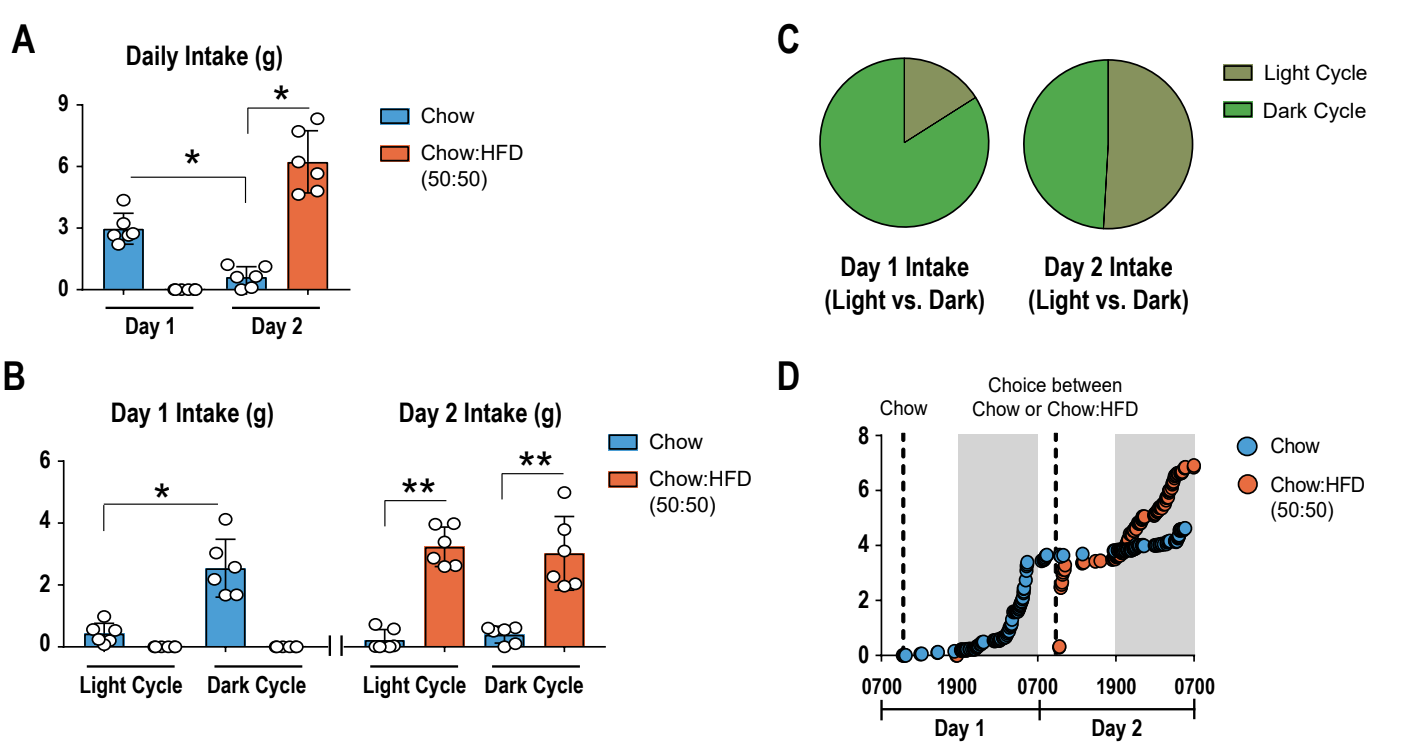
We examined food intake and food preference in C57BL/6J (n=6). Specifically, at 10am on Day 1 mice were allowed unrestricted access to a standard chow diet. At 10am on Day 2, mice were allowed to choose from the standard chow diet, or a diet containing chow and 23.5% high fat diet (50:50 mixture). It was shown that (a) under normal conditions (i.e. consuming the chow diet on Day 1), mice consume the majority of their daily food intake during the dark cycle (1900 - 0700 hours) and (b) when given the choice between diets, mice consumed significantly more of the chow:HFD combination. Interestingly, whereas mice consumed the majority of the standard chow diet during the dark cycle, mice consumed the chow:HFD combination equally throughout the light and dark cycle.
The graphs compare total daily food intake (A), daily food intake during the light versus dark cycle (B), daily food intake as a fraction of the total during the light versus the dark cycle (C), as well as a representative image of cumulative food intake for one mouse (D). For figures A-C, data are presented as a scatter plot (bars denote mean ± standard deviation). * p<0.01, ** p<0.001 vs. corresponding group.