
Science: Lab report
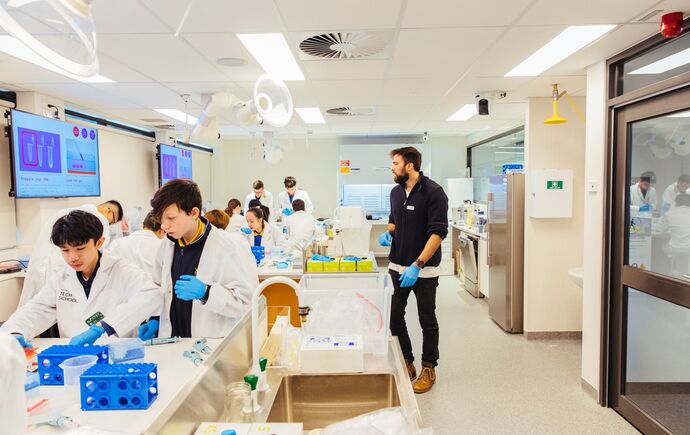
What is a science lab report?
A science lab report is a structured way of clearly and objectively communicating the outcomes of your research experiment. An effective lab report should enable others to replicate your experiment, so it needs to be accurate and precise. Writing a lab report is a great opportunity to practice communicating in a scientific manner.
The general structure of most lab reports includes:
- Introduction - What is your research question? It is essential to also include the aim and hypothesis, as well as references to relevant literature.
- Methods - How did you conduct the experiment? Indicate the procedures and the data analysis.
- Results - What was the data you obtained? Include a brief and objective summary of facts, and present data, often organized as tables or charts.
- Discussion - How do your results address the research question? Analyse the findings and relate them to the hypothesis. This interpretation should also relate your findings to the wider context of related scientific knowledge.
- Conclusion - What was the overall outcome of your research? Offer a brief outline of major findings and their significance.
You can find more information on what to include in each section of your lab report below. However, each science unit will have different requirements, so always check your instructions, the rubric or ask your lecturer what is specifically required to include in your assignment.
 Top tips for science lab reports
View
Top tips for science lab reports
View

1. Use passive and objective voice. Write in the third person, avoiding personal pronouns such as “I” and “we”, as well as contractions (use “is not” instead of “isn’t”). Use an objective tone, avoiding emotional expressions such as “wonderful outcomes”. |
2. Write using the past-tense. Given that you are reporting an experiment that you have already done, your writing should indicate the past perspective. |
3. Communicate accurately and concisely. Try using accurate language, including correct technical terms, and if possible, use quantifications instead of vague terms such as “a lot” or “not much”. Use short and direct sentences, and avoid elaborated and overly complicated expressions. |
4. Do not copy material directly from your lab protocol. The information provided in the protocol is intended to guide you during the experimental or analytical procedures. While there might be relevant information you might need to include in the lab report, the lab protocol is not written in the correct style. |
Lab report structure
-
The title should be concise and needs to describe the purpose of the experiment, in a single, precise sentence.
For example: Determining the Period of a Simple Pendulum
Most experiments will involve measuring, observing or developing something. It is clear from the title above that the experiment measured a property called “period”, and the object of interest was a “simple pendulum”.
View Close Check your understanding
View
Check your understanding
View
-
Sometimes you might be asked to include an abstract in your lab report. However, this won't always be the case, so check your instructions. If you do need to provide one, it should be a brief overview of the entire report, which is therefore the last section to be written. Keep it short: only one paragraph, of about 150 to 300 words.
Your abstract must be clear enough for the reader to understand your experiment without reading the entire report, and is presented as the first section. In general, it summarises each section of your report in one to two sentences, by answering the following questions:
- What was the aim and research question addressed by the experiment?
- What method was used to answer the question?
- What was the main result?
- What is the significance of this finding?
-
The introduction is an important part of your lab report. In this section you need to explain the background knowledge related to your topic, including theories and concepts, and any relevant laws, equations or theorems.
The structure often goes from the broad context, offering a review of relevant previous research, and then narrows down to the specific research question you are addressing. It is imperative that you indicate the source of the information you present, by including in-text references to literature, to maintain academic integrity. It is good practice to format them according to the specific referencing style you are using, as soon as you write them in, and ensure you also add them to the list of references. Check the assessment instructions to see if you are expected to use a particular referencing system, or ask a member of the teaching team.
The introduction usually finishes with statements of the aim or purpose of the experiment, and of the hypothesis.
What makes a good hypothesis?
A hypothesis (plural is hypotheses) is a single, clear and concise statement, which:
- Needs to be informed by knowledge from literature
- Is a testable prediction of how the experiment will unfold
- Should only have one dependent and one independent variable (see below)
- Must indicate both variables and the relationship between them
- Can be either supported or disproved by the experimental result
In regards to experimental variables, an appropriately formulated hypothesis should have only one of each of these:
- Dependent variable, is what you measure or observe a variation, and therefore needs to be changeable
- Independent variable, is what you manipulate in order to see if there is an effect or change in the dependent variable
Are these statements well-formulated hypotheses?
For each statement, decide whether it is a well-formulated hypothesis. If not, explain why.
View Close
Check your understanding
View
-
This section offers a detailed account of how you conducted the experiment. It should contain enough guidance for others to replicate the procedure and achieve a similar result. Accordingly, it needs to include relevant information, which depending on your discipline, might include: number of participants; specific tools and/or pieces of equipment used; chemicals/solutions and their concentration. Furthermore, it is preferable to use reputable conventions for indicating numbers, such as the Monash editorial guide, and it’s fundamental to use the correct units of measurement from the International System of Units (SI Units).
This section should also include any changes made to the original protocol which unexpectedly occurred during the experiment. A great way to keep track of these changes is to use a lab notebook to record them, along with any additional useful information that might be important when analysing the results.
Turn your lab protocol into the method section of your lab report
You will generally be provided with a set of instructions, called a lab protocol, to complete your lab work. These instructions often include information such as:
1 how to set up and use the apparatus and equipment
2 a list of materials
3 the steps needed to collect the data
4 any potential experimental difficulties and how to resolve or avoid them.
Below is an example of instructions to carry out a first-year chemistry experiment:
Lab protocol
- Use a clean pipette to measure 25 mL of HCl(aq) into a 100 mL conical flask.
- Rinse a burette with standardised NaOH(aq) and clamp it to the retort stand as shown in Figure 2.
- Fill the burette to the 0.0 mL marking with standardised NaOH(aq). Remember to take the reading from the centre of the meniscus, and from eye level. Record the actual reading in Table 1.
- Place a sheet of white paper under the burette. This is to make it easier to observe the colour change during the reaction.
- Place the conical flask onto the white paper and add five drops of universal indicator to the flask.
- Titrate the standardised NaOH(aq) into the flask with constant swirling until there is an observable colour change. (Your demonstrator will provide additional guidance on the specific technique.)
These instructions, including specific information such as 'use a clean pipette…' or 'remember to take the reading from the centre of the meniscus…', are very helpful for a student who may be performing the technique for the first time. However, they are not relevant information that needs to be included in the lab report.
Moreover, while the instructions are written in the present tense, your methods section should be written using the past tense, as you are reporting something that you’ve done previously.
Lastly, while lab protocols are often written as a step-by-step set of instructions, using bullet points, the methods section of your lab report generally needs to be written as a cohesive paragraph.
Nevertheless, there are ways you can change the language of the instructions to write your method section. Below is an example of how the previous lab instructions were summarised into a paragraph in the methods section of a laboratory report:
Lab report:
Initially, 25 mL of HCl(aq) was pipetted into a 100 mL conical flask. A burette was filled with standardised NaOH(aq), and then five drops of universal indicator were added to the flask. The standardised NaOH(aq) was titrated into the flask, with constant swirling, until there was an observable colour change.
How to use the passive voice in lab reports
In the example below, the first person plural is used in the active voice, i.e. "we initiated". While most science units require that you report in the passive voice, some require the active voice. Check your unit information or ask your teacher.
Instruction
Your report
Initiate the bicarbonate feed pump. We initiated the bicarbonate feed pump. (active voice) The bicarbonate feed pump was initiated. (passive voice) View Close
Check your understanding
View
While in science the passive voice is generally preferred, some disciplines may allow or prefer the active voice. Read samples of student reports below and identify which examples are written in passive voice, and which use active voice.
-
In the results you need to present the data collected during your lab experiment. This section should include:
- a factual summary of the major data trends or patterns. The text should not include any interpretation or explanation of the data, nor does it need to include specific data values. Conversely, the text must include explicit references to the specific table and/or chart where the data is presented.
- the data results, usually presented in tables and/or figures, after any necessary calculations and analysis, including statistics, were performed.
Calculations
When you take your raw data and perform some sort of mathematical operation, it is good practice to show the equations or formulas you used in your analysis, as well as one worked example. Calculations that are very long, or repeated multiple times, are usually included in an appendix (see below).
In some disciplines, if formulae are used, it is common to number them as equations. Check some examples below:
The rotameter settings were converted to mass flow rates using equation (4), below:
m = 0.0011x − 0.001 equation (4)
where x is the rotameter setting.
The temperatures at the thermocouple points were then plotted against the mass flow rates (see Figure 6). The efficiencies were calculated using equation (1)
where T....
and plotted against the mass flow rate (see Appendix 1 for sample calculations). The efficiency curves for both the wrapped and soldered joints can be seen in Figure 7.
Error and statistical analysis
Error analysis is a type of calculation that indicates the accuracy of your results, usually done by determining the level of uncertainty. The sources of error that you need to consider will vary between experiments and disciplines, but you will usually need to factor in both random and systematic errors.
Any analysis and calculations of the errors or uncertainties in the experiment are included in the results section, unless otherwise specified. In some disciplines the analysis and uncertainty calculations are presented under their own heading. Check the requirements given in your unit information or lab manual, or ask your teacher if you are unsure where to place calculations.
If you carry out statistical analysis you need to indicate the test you performed, and relevant information such as significance and level of probability.
Tables and figures
Most numerical data are presented using tables and/or charts, which are labelled “figures” in a lab report. All of them need to be numbered sequentially and to be explicitly mentioned in the text.
Both tables and/or figures must have a caption, following standard conventions - check the examples below for required information. The positioning of the caption, however, often varies between tables (usually placed above) and figures (usually placed below), although you should check the requirements of the specific referencing system you are using.
Any measurements, either indicated in the text or in a caption, as well as in a column/row of a table or on the axes of a graph, must be accompanied by the respective units associated with it (usually in brackets). However, some measurements such as pH or Absorbance, do not have units, whereas other times a measurement can have a combination of units. For example, in the table below, the units of measurement for the speed 374 would be m/s and the units of measurement for the flow 14 would be m3/s. Always use appropriate conventions for indicating numbers, such as the Monash editorial guide, and the correct SI Units.
Table 1 - Title of the table. Brief description of data, including indication of experimental variables (and their units of measurement) and explanation of any abbreviations or symbols included.
Dependent variable 1 (units)
E.g. Distance (m)Dependent variable 2 (units)
E.g. Volume (m3)Independent variable A (units)
E.g. Time (s)374 14 Independent variable B (units) 472 17 In regards to figures, these can include numerical data, displayed in various types of charts, or images, such as scientific drawings or microscopy images.
If you are using a chart, ensure that you select the right type according to the data you want to visualize. For example, bar charts such as the one below, are great for discrete categories or groups. Other charts, such as scatter plots, are more suitable when the variables are continuous or when you want to show correlations or clusters between your experimental variables. You can also use line charts (suitable for showing change over time) or pie charts (adequate for displaying percentages). To learn more about data visualization, you can access a Sage Research Methods guide, available online from the Monash Library. Note that the formatting of tables and figures varies by citation style.
Figure 1
Title of the chart (In italics)The figure title should include a brief explanation of the data, of any abbreviations, symbols or colours (which might be shown in the legend), as well as indication of the experimental variables (including their units of measurement). Moreover, it should include statistical information, such as indication of what the error bars represent or if there is significance.
If your experimental result is a scientific drawing or a microscopy image, it should also be presented as a numbered figure, with an appropriate caption below. It is essential that the image includes a scale bar, to give an accurate idea of the actual size of the specimen.
For microscopy images, the caption also needs to include relevant information such as the staining method (if one was used), and the magnification at which the image was captured. If the image is from another source, include a citation, and whether you have modified it, to avoid collusion or plagiarism.
-
In the discussion you provide an interpretation and an evaluation of your results. Firstly, you need to summarise your key results and explain how they relate to your aim and hypothesis presented in the introduction. You also need to compare and contrast your results with relevant scientific literature, some of which you would have already referred to earlier in the report.
This is a very important section of your report, usually accruing many marks, so ensure you devote a considerable amount of effort, and demonstrate your expertise. Here are some guidelines to assist you writing a comprehensive discussion:
1Summarise key results and relate them to your research questionIdentify and describe any major trends or patterns present in your results. If these are numerical, it is preferable to state their values, rather than simply using unspecific words such as “higher”, “lower”, “increased” or “decreased”, which can make the information vague. If any statistical analysis was done, the outcome, such as significance or lack of it, needs to be indicated.
Interpret what the results mean in relation to your research question and how they address the aim of the experiment. Crucially, use your experimental results to specifically evaluate the prediction you made in the hypothesis. Ensure this analysis is as accurate and as objective as possible.
Very importantly, remember that hypotheses are simply testable statements, which can either be validated or refuted by the experimental results. A common misconception is that the results always need to support the hypothesis. There are many instances when this won't be the case, for example, if there were unexpected results.
2Analyse your major results in light of relevant literatureNext, your results need to be discussed in relation to relevant scientific literature. Ideally, this engagement with published research works is done critically and constructively. For example:
- If there were any theories, laws or concepts you’ve explained in the introduction, these need to be revisited and related to your results
- If there were discrepancies between hypothesis and your results, propose explanations based on your readings
- If there were unexpected results, that didn’t match your predictions, try to evaluate them using evidence from comparable research
- Compare and contrast your findings with other similar studies, preferably from recent, peer-reviewed research publications
3Offer an overall evaluation of your study and beyondFinally, critically evaluate your study. This can be done by considering any aspect of the experiment, or of the analysis, that could’ve benefited from an alternative approach. Some aspects you might consider discussing include:
- Were there any inaccuracies or misguided assumptions in the formulation of your aim, hypothesis or research question?
- What were some limitations of the methodology you used? or some flaws in the experimental design? Were there any procedures which were not experimentally controlled that could influence the results? Were there any sampling biases? Any limitations due to sample size?
- Consider your analysis of the results: check if any source of error might have influenced your interpretation of the experimental findings, particularly in relation to the accuracy and precision of answering the research question, the aim or evaluating the hypothesis.
It is essential that the assessment of the limitations of the study is supported by references to relevant literature, and accompanied by constructive suggestions of how future iterations of the experiment could be improved.
Lastly, your analysis could highlight any implications of your study: does it need further investigation? Why? How should it be done? Also, you may offer some suggestions of future directions for the research.
View Close
Check your understanding
View
The discussion example below is from a first-year Biology unit. The aim of this experiment was to identify decomposition rates of leaf breakdown to establish rates of energy transfer.
Drag each description of each component of the Discussion section to its example. Notice the order in which the components make up a coherent Discussion section.
-
In the conclusion you need to summarise your report, usually in just one paragraph. In this way, it's similar to an abstract, but with more emphasis on the results and discussion. Sometimes this section is not required, so check the instructions for your lab report or clarify the requirement with your teacher.
A conclusion never introduces any new information, results nor ideas. Instead, it provides a brief summary of what has been presented throughout the report. When writing a conclusion you should:
- briefly restate the purpose of the experiment (i.e. the research question you study sought to answer)
- identify the main findings (i.e. the answer to the research question)
- note the main limitations that are relevant to the interpretation of the results
- highlight the significance of the main findings and how they contributed to the broader understanding of the problem.
Conclusion example with feedback
Student's text Lecturer's comment The concentration of salicylic acid in commercially available aspirin tablets was determined through UV spectroscopy. Begin by describing the aims of the experiment and the method used to achieve them. The mean concentration from three different tablets was determined to be 301.1 ± 4.36 mg per tablet, which is within commercially permitted limits. Specific description of final results. Note the use of specific numbers and units. The results for individual tablets were found to be dependent on how finely the tablets were crushed before they were dissolved. Standardised approach to breaking down the tablets might further improve the accuracy of the results. Summarises the main reasons for any discrepancies and recommends improvements to overcome experimental limitations. These findings show that analytical chemistry techniques such as spectrometry can be used for fast, accurate determination of compound composition. This is important in many industries, where consistency is crucial for effective use of the product, or is vital to the safety of the product. Briefly summarise key results with respect to the broader context. -
Your lab report must include references to relevant literature, typically in the Introduction and Discussion. These need to be indicated both as “in-text citation” (an abbreviated form, in the specific sentence where you are sharing the information), and as a “full reference” (including all the information regarding that publication, presented as part of a list). The reference list is a separate section that comes after your conclusion and before any appendices (if these are included in the report).
Check your lab manual or unit information to determine which referencing style you are expected to use, and strictly adhere to all the formatting requirements for both in-text and reference list. You can find some of the most commonly used referencing styles, as well as tutorials on citing and referencing, available online from the Monash Library.
References
Jones T, Smith K, Nguyen P, di Alberto P (2017) Effects of habitat overlap on population sampling. Environmental Ecology Journal 75, 23–29. doi: 10.5432/1111.23
Tian M, Castillo TL (2016) Solar heating uptake in Australia: rates, causes and effects. Energy Efficiency Reports. Report no. 10, The Department of Sustainability and Environment, Canberra.
-
An appendix (plural = appendices) contains material that is too detailed to include in the main report, such as tables of raw data or detailed calculations.
Each appendix must be:
- given a number (or letter) and title
- referred to by number (or letter) at the relevant point in the text.
Example
The calculated values are shown in Table 3 below. For detailed calculations, see Appendix 1.
NoteThis sample is provided to give suggestions about what you might include in your assessment and how it could be structured. This sample is also not perfect. Always follow the assessments instructions provided in your unit's assessment information to ensure you are addressing the assessment criteria. |
-
How to write a journal article
Your lab report closely follows the structure of a published research article. Discover how each section works structurally, how to write an effective title, and how to submit your article.
-
Write clearly
Stating values instead of “higher” or “lower” is one part of writing precisely. Learn how to say exactly what you mean, in sentences and paragraphs your reader can follow.
-
Dos and dont's of academic integrity
You may collect data as a group, but your report is usually assessed individually. Find out where collaboration ends and collusion begins, and how to use published research with integrity.