Methodology
Method for Australia's SDG baseline assessment
Introduction
The 2030 Agenda for Sustainable Development was adopted by the United Nations General Assembly in September 2015 (A/RES/70/1) as a plan of action for people, planet and prosperity. The centrepiece of the agenda is a set of 17 goals and 169 targets that are integrated and indivisible. All countries agreed to implement the agenda—taking into account national priorities and capacities—and to report on progress made against the targets over their 15-year lifetime to 2030. An initial set of 232 official indicators was adopted by the UN General Assembly in 2017 to assist with national reporting. Given the very broad and complex scope of the SDGs, it is important that countries focus their national implementation efforts on priority targets across the goals.
Selecting SDG targets and indicators for SDG Transforming Australia
SDG Transforming Australia reviews progress across all 17 goals and encompasses over 86 priority SDG targets and 144 indicators. The selection of targets and indicators for the assessment was undertaken by the National Sustainable Development Council and expert advisers (Goal Leads) based on consideration of several important factors, including their importance for Australia’s sustainable development, relevance to the global SDG framework, and data quality, timeliness and reliability. The aim was to find an appropriate balance between reporting on the official SDG framework, while at the same time assessing the key areas of importance for Australia. The selection of targets and indicators was facilitated through several meetings of the National Sustainable Development Council and stakeholders in late 2017 and early 2018.
Clear targets are important for assessing and benchmarking Australia’s progress on the SDGs, however, in many instances, the SDG targets use generic language and do not include specific, numerical target values. This was intentional, as it is the responsibility of each country to set its own national target values guided by the global level of ambition and taking into account national priorities and circumstances. The lack of target values for Australia remains an important gap. To complete the assessment, where possible, the National Sustainable Development Council has identified an existing target value or proposed a value based on expert analysis.
The SDG targets and indicators are inextricably linked, and the selection and adaptation of targets ultimately influence the selection of relevant indicators. The SDG Transforming Australia indicators strike a balance between reporting on the official SDG indicators, as well as complementary indicators of critical importance and relevance for Australia. Other factors such as data availability and quality were also considered during this process. Figure 1 provides a decision tree outlining the process adopted.
All indicators used in the assessment are linked to a specific SDG target and goal. The differentiation between SDG and national indicators is made in baseline assessment through the use of indicator numbers and labels. In all instances, the official SDG target and indicator numbering is used. Three types of indicators are reported:
- Official SDG indicators: these are the exact indicators taken from the SDG framework and are designated using the official indicator numbering used in the 2030 Agenda (e.g. 1.2.1, 7.3.1 etc.)
- Alternative SDG indicators (ALT):these indicators are variations on the original SDG indicator where it was necessary to adapt the indicator slightly to align with Australian datasets and reporting. These are designated using the official indicator numbering plus an ALT extension (e.g. 1.2.1ALT, 4.3.1ALT, etc.). Where there is more than one ALT indicator for a specific SDG indicator, numbering is also added (e.g. 1.2.1ALT1, 1.2.1ALT2 etc.).
- Complementary national indicators (NEW): these indicators are new indicators selected to complement the set of SDG indicators due to their high importance and relevance for reporting on a particular SDG target in the Australian context. These are designated using the official target numbering plus a NEW extension (e.g. 1.3.NEW, 6.1.NEW). Where there is more than one NEW indicator for a specific target, numbering is also added (e.g. 6.1.NEW1, 6.1.NEW2, 6.1.NEW3 etc.)
 Figure 1: Decision tree for selecting indicators for the assessment
Approach to the SDG Transforming Australia assessment
The practice of assessing progress on the SDGs is still an emerging one. Several initial baseline assessments have been completed at various global, regional and national scales, with each adopting a range of different approaches and methods.
Australia’s SDG baseline assessment is an indicator-based assessment that combines several forms of analysis. Australia’s progress on the SDGs is assessed at a broad level through the use of an SDG dashboard, which provides a ‘traffic light’ assessment of progress across a selection of indicators, highlighting whether an indicator is ‘On Track’, ‘Needs Improvement’, ‘Breakthrough Needed’ or ‘Off Track’. Time series trends, as well as target and benchmark values, are used to assess progress. This analysis is complemented with a detailed assessment of each indicator through the use of charts and expert analysis.
The results are integrated into the SDG Transforming Australia website, however a summary dashboard table is also available for download as a document here.
Method used in the SDG Transforming Australia dashboard assessment
The method used for the dashboard assessment was based on a review of the expert literature and recent SDG baseline assessments, taking into account the specificities for Australia’s assessment. Each indicator is assessed using the methodology summarised below and allocated a ‘traffic light‘ symbol reflecting Australia’s progress: ‘On Track’ (![]() ), ‘Needs Improvement’ (
), ‘Needs Improvement’ (![]() ), ‘Breakthrough Needed’ (
), ‘Breakthrough Needed’ (![]() ), ‘Off Track’ (
), ‘Off Track’ (![]() ), or ‘Not Assessed’ (
), or ‘Not Assessed’ (![]() ). The results of the assessment have been synthesised into a simple summary dashboard table, which includes:
). The results of the assessment have been synthesised into a simple summary dashboard table, which includes:
- A short description of the SDG target, indicator, and units.
- Australia’s reference value (first year ~ year 2000) and baseline value (latest year ~ year 2015)
- Trend direction and favourability: arrows are used to summarise the direction of the trends, with colours used to interpret the favourability of the trend—i.e. green for an improving trend, red for a worsening trend, and orange for no trend (<1% change). The dashboard table also includes the compound annual growth rate (CAGR) and the total % change over the period from the first to the last data point.
- Target value and source, or benchmark value and source (where used).
- Outcome of the assessment—comparison of observed trend or progress versus the desired trend or progress, with the outcome presented using the traffic light categories (


 ). This applies one of several methods (A, B, C or D), depending on the availability of targets or benchmarks and trend data. For each method, a rule is used to allocate the traffic light symbols based on the outcomes of the analysis.
To provide an aggregated assessment of how Australia is progressing at the goal level for each of the 17 goals, the method also allocates scores on a linear scale (1–4) for each of the traffic light symbols. The aggregated score for each goal is then calculated as the average score for its set of indicators.
The results are integrated into the SDG Transforming Australia website, however the dashboard assessment is also available for download as a document here.
Approach to target setting and benchmarking
The preferred approach for the assessment was to use numerical target values for each indicator for 2030 combined with long-term time series data. However, clear numerical target values were absent for the majority of targets and indicators assessed. To fill this gap, the following decision process was applied:
- Adopt the SDG numerical target value where available.
- Where an SDG numerical target value was not available, adopt an existing national or international target value.
- Where 1 and 2 were not available, adopt a target value agreed to by Council (e.g. based on the SDG Index green thresholds, or expert judgement).
- Where no target value could be set, either use a benchmark value (e.g. OECD average) to assess the current status of indicators, or assess the indicator based only on the trend. Similarly, if no trend data was available, the target or benchmark value was used to assess progress.
Method for assessing trends and progress
To cater for gaps in target values and time series data, this assessment of Australia's SDG progress combines several different methods. In line with international practice, the period of the analysis was set from 2000 (or first available year after 2000) to the latest year available (most commonly 2015 or 2016). In general, a minimum length of 10 years and a minimum number of three data points were required to complete the analysis. However, for indicators with only a recent time series, a short-term (<10 year) trend was calculated based on a minimum of three consecutive data points.
Each indicator was assessed using one of the four methods described in the table below. A set of rules associated with each method was used to assess Australia’s progress and allocate traffic light symbols(![]()
![]()
![]()
![]() ). Methods vary depending upon the availability of trend data as well as target or benchmark values. Trend data is evaluated using the compound annual growth rate (CAGR).
). Methods vary depending upon the availability of trend data as well as target or benchmark values. Trend data is evaluated using the compound annual growth rate (CAGR).
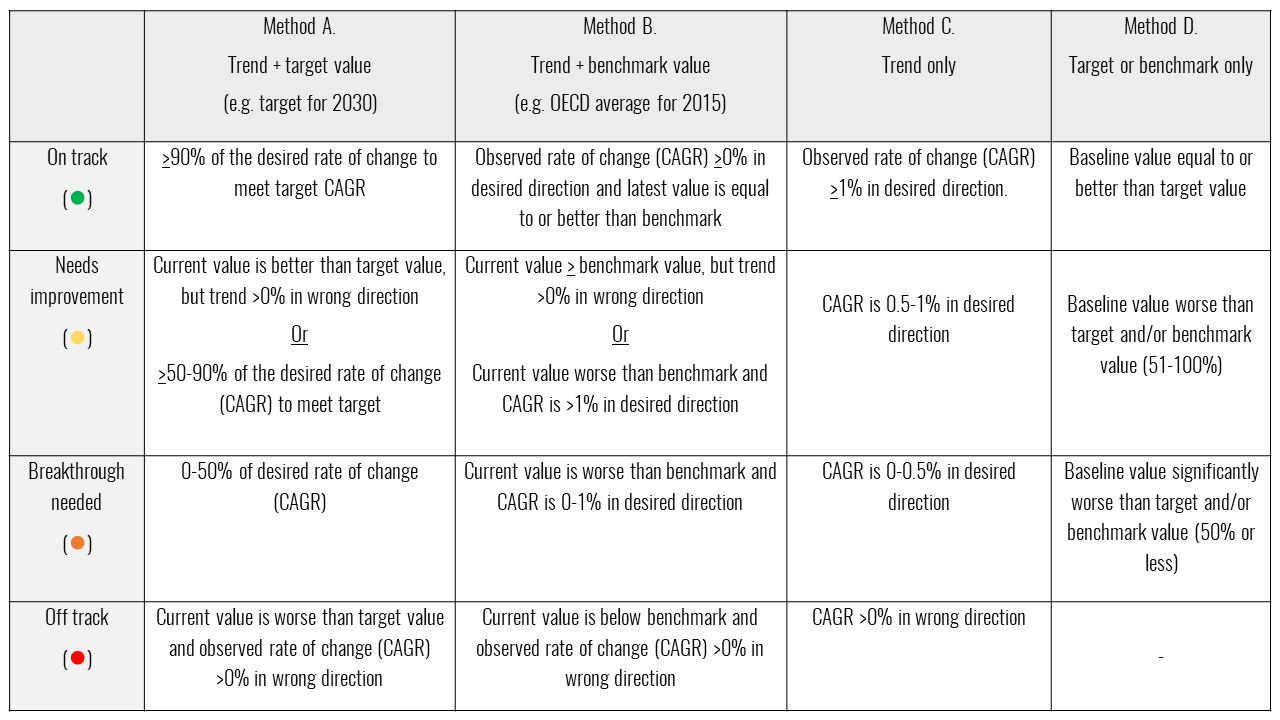
The methods outlined above adopt similar approaches to recent SDG baseline assessments. In these studies, the preference is for the use of both time series data as well as a clear target value and target year to assess progress (Method A). In such instances, the actual rate of change of the indicator (based on the observed CAGR) is compared with the desired rate of change that would be required to meet the specified target value in the target year (e.g. x% by 2030). Australia was considered ‘On Track’ when the observed CAGR was greater than 90% of the rate needed to achieve a target by 2030. Similarly, Australia was considered ‘Off Track’ where an indicator value was below a target value and the observed CAGR was moving in the wrong direction. Approximately 40% of indicators were assessed through this method.
Where an indicator had available time series data but lacked a clear target, the assessment used international benchmark values (e.g. OECD averages) to complete the analysis (Method B). In such cases, Australia was considered ‘On Track’ where an indicator value was better than an available benchmark value and the trend was moving in the desired direction. A further 20% of indicators were assessed by this method.
Where a time series was available but there was no available target or benchmark, trend data alone was used to complete the analysis, again using the observed CAGR (Method C). A rate of change of more than 1% per annum was considered a significant change, and the desired direction of the trend was used to interpret progress. Approximately 30% of indicators were assessed based solely on time series data.
In cases where no trend was available, the assessment relied solely on a comparison of the latest data point against a target or benchmark value (Method D). This method was applied to the remaining 10% of indicators.