
Grid topography and energy forecasting
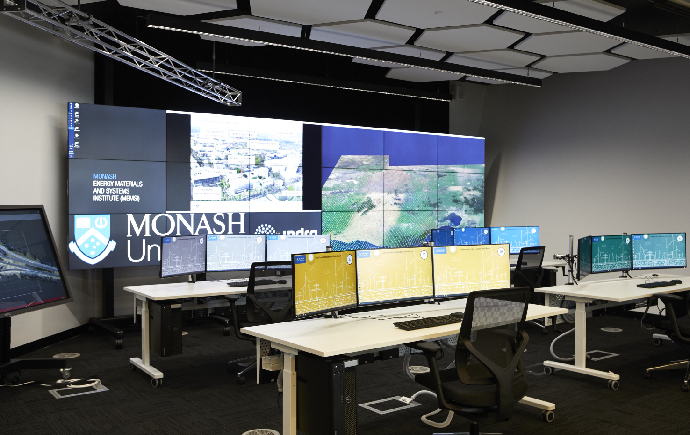
To forecast electricity demand, you usually base your forecast on historical data. However, we do not have the same long data series for renewables as for fossil energies. We will need a model combining the various generation sources, the total energy demand, and predicting how weak grids behave with increasing uptake of renewables. In this second instalment, we will look at the use of smart meter data to estimate the topology of the grid and advances in energy forecasting. With Abu Pengwah and Rakshitha Godahewa.
Distribution networks are sometimes referred to as the ‘last mile of the electricity network’, because they are the wires that physically reach the end-users' houses, at the edges of every grid. Victoria is one of the few states in Australia with smart meters deployed at every house. Data from these smart meters can be used to approximate the topology of the grid.
Abu Pengwah (2nd Year PhD candidate, Faculty of Engineering/ Department of ECSE) supervised by Dr Reza Razzaghi and Dr Lachlan Andrew (Lecturer in Computer and Information Systems, University of Melbourne), focuses on advanced data analytics methods to enhance the visibility of distribution networks. He is working on a cost-effective way to estimate the topology of a power grid using available data such as smart meter measurements. “One of the main bottlenecks of managing the power grid is due to the lack of observability and access to network topology and parameters in low-voltage distribution networks. With regular maintenance and reconfigurations, the network changes from time to time such that manual recordings are prone to errors”.
Abu’s research encompasses techniques from three areas; Power Systems, Signal Processing and Computer Science. “Measurements from smart meters are used with power systems and graph theory constraints, to estimate the resistance and reactance values of the power lines connecting the houses (loads) and the Low Voltage transformer powering the grid. A graph learning algorithm estimates the network with unmetered buses, from the impedance estimates of the loads”.
Abu novel approach has been implemented and tested on synthetic and smart meter measurements from a low voltage feeder in Australia. “The synthetic data consisted of both an IEEE test case and randomly generated topologies. The impact of noisy measurements was considered for randomly generated topologies, with the wide range of the signal-to-noise ratio. The performance has been validated using real smart meter measurements. The proposed method proved to be superior to the state-of-the-art approaches and the findings have been submitted for publication in a top-tier journal. “Now, I’m working on a similar objective of identifying the topology and electrical characteristics of power networks, but with a new approach using the electromagnetic transients as a result of switching events. This will be used in fault location algorithms.”
As right now, Abu’s technique applies to low voltage. “My new project is to have some kind of algorithm to work with all scales, low, medium, and high voltage, so I can propose a target to industry and work with them to develop robust techniques. Industries might have different interests with what I’m doing, but hopefully, I can integrate theirs and my interests and work out something that can be helpful to both industry and society”. The outcomes of his project will enable to increase the PV housing capacity, to coordinate activities between different PV inverters, to minimise losses, and outages, and many other benefits.
Enhancing the integration of wind and solar power into the national electricity grid requires precise energy production and demand forecasting.
Dr Christoph Bergmeir mentions “we can see that people are consuming more energy in the morning when they get up and get ready for work, it slows down when they leave to work and it peaks back up when they come back home, adjusting their home temperature, cooking, etc. The clear power demand curve varies daily, weekly and seasonally. If we look at energy production, we can see a difference between fossil fuel and renewables production. If you run a fossil fuel power plant, you can react to higher demand by burning more fossil fuel. With renewables, we depend on the day/night pattern, on weather conditions and the storage capabilities. We cannot just produce more energy on the spot, it depends on how much sun is shining, how much wind is blowing. If a power plant contributes to network instability by producing more/less energy than their forecast, they get heavily fined. They have to stabilise the network, usually by paying others to produce or consume larger amounts of energy on short notice.”
Rakshitha Godahewa (2nd Year PhD candidate - Faculty of Information Technology, BSc (Hons) in Engineering, BCS) supervised by Dr Christoph Bergmeir and Prof Geoff Webb (Research Director, Monash University Data Futures Institute), focuses on improving the accuracy of time series forecasting using global ensemble models; like Recurrent Neural Networks (RNN), Feed-Forward Neural Networks (FFNN) and Pooled Regression models. “We predict the future of time series via different machine learning techniques and increase the forecasting accuracy by optimally aggregating a set of forecasting models. My main goal is to use these models with electricity demand forecasting and energy forecasting. Accurate time-series forecasting can be very beneficial for many businesses and industries. Currently, we are using the Ausgrid dataset with our experiments which represents the energy consumption of Australian households. I recently presented my main research findings at the 40th International Symposium on Forecasting (ISF)”.
During the first few months of her PhD, Rakshitha developed a new classifier supporting accurate high-dimensional stream classification. Her research paper on the subject was recently published at the International Joint Conference on Neural Networks (IJCNN), UK, 2020.
Rakshitha worked on a project with Honeywell Ltd where she used temperature forecasts provided by an RNN model to optimise the energy consumption of air conditioning systems when rooms are unoccupied. “We simulated and predicted the future inside temperatures of lecture theatres using machine learning technologies and used them to optimise the energy consumption of air-conditioning systems by optimally controlling the setpoints”. A simulation study was conducted over one week for a university lecture theatre. As shown in the following table, the results indicate that the optimal setpoints given by the proposed approach can lead to 20% of energy savings in average compared to the traditional air conditioning systems which use static thermal setpoints. The conclusions of this research are valid to similar rooms including hotel conference rooms and libraries, therefore have high commercial benefits.
Table 2. Results of the university lecture theatre simulation study conducted for one week (R. Godahewa et al., 2020).
| Day | Static Setpoints (in minutes) | Optimal Setpoints (in minutes) | Heating Reduction (%) |
|---|---|---|---|
| Monday | 252 | 202 | 19.84 |
| Tuesday | 322 | 265 | 17.70 |
| Wednesday | 396 | 284 | 28.28 |
| Thursday | 467 | 380 | 18.63 |
| Friday | 365 | 306 | 16.16 |
| Average | 360.4 | 287.4 | 20.26 |
She has also developed a new forecasting model, especially suitable to forecast weekly data and tested it on 6 datasets where 2 of them are energy-related. To help the research community, she built a new repository containing time series benchmark datasets where the researchers can use the datasets to test their newly proposed forecasting algorithms.
For further information
R. Godahewa, C. Bergmeir and A. Prouzeau, “Simulation and Optimisation of Air Conditioning Systems using Machine Learning”, AIE Poster Competition 2020.