Methodology
Outline of method for the Transforming Australia Assessment 2024
This is the third Transforming Australia (TA) SDG Progress Report 2024. Drawing on the latest data, this assessment provides an updated report card on Australia’s progress on the SDGs focusing on 51 priority targets and 80 indicators. It also includes a forward-looking modelling analysis of future opportunities that could boost Australia’s progress on the SDGs by 2030 and 2050. Results from the analysis are presented as a summary report and dashboard and interactive charts and other materials accessible through this website.
The methods applied in the assessment are based on the approach developed for the first progress report in 2018 led by the National Sustainable Development Council and which have been peer-reviewed[1]. Important methodological considerations for the assessment include the selection of indicators, the setting of 2030 target values, and the methods applied to evaluate progress towards the SDGs. In all cases, decisions were made by the project team drawing on advice from experts.
A brief description of the methods is provided below. Further details are provided in the Technical Note which you can download here.
Selection of indicators
The selection of SDG targets and indicators for this assessment was informed by the indicator framework developed for the 2018 assessment which underwent broad consultation with experts and stakeholders. For this assessment, a set of high priority SDG targets and indicators were selected based on the following set of criteria:
- Relevance for Australia’s sustainable development given current policy priorities and context
- Availability of updated time series data since the TA 2020 assessment
- Potential for the indicator to tell a compelling story
- Balance of economic, social, environmental issues and balance across the 17 SDGs.
- Availability of target/benchmark values
- Relevance for key SDG transformations identified by experts[2, 3]
Selection of 2030 target values
The TA 2024 assessment includes 2030 target or benchmark values for Australia for all 80 indicators. This is important as it enables a more robust assessment of Australia’s progress on the SDGs which considers the scale and pace of transformations needed to achieve the goals by 2030. This was challenging in some cases as the official SDGs framework fails to set quantitative target values for most indicators. The 2030 Agenda places responsibility on national governments to set their own targets in line with the global level of ambition and in consultation with relevant stakeholders. However, Australia still lacks official targets for most indicators.
The 2030 target and benchmark values used in the assessment were selected based on available evidence and the following decision process (in order of preference):
- Numerical SDG targets from the official SDG framework
- Existing national targets, for example from the Council of Australian Governments (COAG) or national strategies
- Targets set by the National Sustainable Development Council (NSDC) for the 2018 assessment
- Targets/benchmarks sourced from other global and regional assessments of the SDGs, including the Sustainable Development Solutions Network’s global SDG index or United Nations publications
- Targets/benchmarks based on a comparison with top-performing peer countries (e.g. an average of OECD top five performing countries) or optimal historical performance
- Benchmarks set based on a steady improvement on the 2015 baseline value of 1% per annum to 2030 (using a compound annual growth rate).
Method for assessing progress and compiling Australia's SDG performance dashboard
The quantitative method for assessing progress combines an analysis of time series data and 2030 target values for each indicator. Conceptually, the historic trend in data observed for each indicator is compared against the ‘theoretical trend’ that would be needed to achieve a quantitative target in 2030 – or a desired ‘Target Path’. This allows for an easy comparison of how Australia is tracking for each indicator. In simple terms, a quantitative comparison is made between Australia’s actual progress and the progress that would be needed to reach the 2030 target, which is expressed as a percentage of progress. The results are then interpreted using a set of traffic light symbols (![]()
![]()
![]()
![]() ) which provide a dashboard assessment of how Australia is tracking on each target (Figure 1).
) which provide a dashboard assessment of how Australia is tracking on each target (Figure 1).
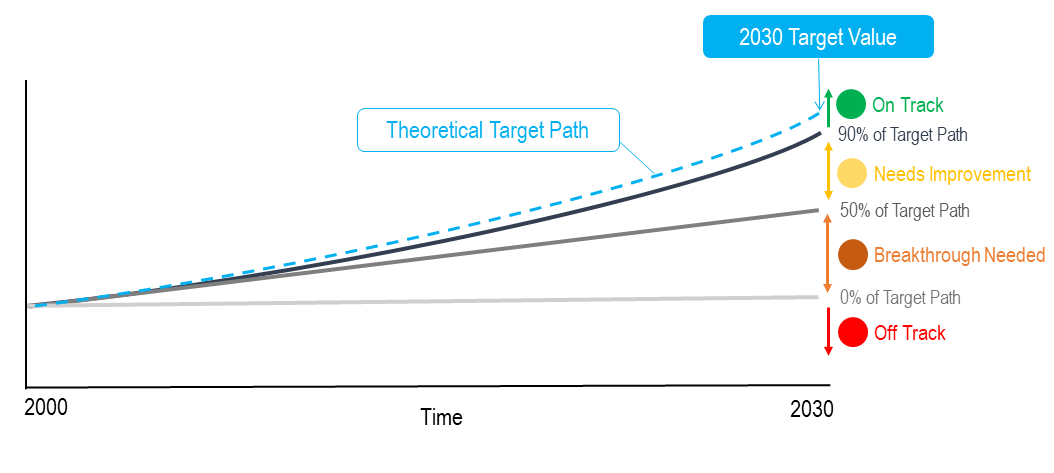
Figure 1. Conceptual diagram of the theoretical ‘Target Path’ and threshold values for assessing indicators and allocating traffic lights (example of a target that requires the indicator value to increase to improve performance).
Where available, datasets for the indicators commence in 2000 up until the latest available year. The assessment of trends is based on the ‘compound annual growth rate’ (CAGR) formula, which assesses the pace and direction of the evolution of an indicator. This formula uses the data from the first and the last years of the analysed time series to calculate an average annual compounded rate of change (%). To assess progress, the actual rate of change of the indicator based on the observed CAGR (1) is compared against the desired rate of change that would be required to meet the specified target value in 2030 (or the ‘theoretical target path’ in Figure 1).
This comparison calculates a ratio (R) by dividing the observed rate (CAGRO) by the desired rate (CAGRD) (2).
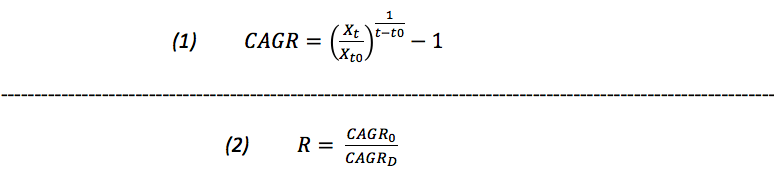
Table 1 below provides a description of the thresholds used for evaluating the calculated ratio (R) and allocating the traffic light symbols. One of four assessment results is possible for each indicator: ‘On Track’, ‘Needs Improvement’, ‘Breakthrough Needed’, and ‘Off Track – Going Backwards’. For the dashboard, the assessment evaluates both the long-term trend (from 2000 to latest data point) as well as the short-term trend (last 5 years of data), where available.
| Category/Symbol | Ratio of actual and required growth rate |
|---|---|
|
On Track | Latest value is better than target, or >90% of the desired rate of change (compound annual growth rate or CAGR) needed to meet the target. |
|
Needs improvement | 50-90% of the desired rate of change (CAGR) to meet target |
|
Breakthrough needed | 0-50% of desired rate of change (CAGR) to meet the target |
|
Off Track | Latest value is worse than target value and observed rate of change (CAGR) >0% in wrong direction. |
Table 1. Approach and thresholds for assessing trends of indicators with quantitative targets
Method for assessing the change since the previous TA assessments
Australia’s progress towards the SDGs is dynamic and the assessment results for many of the indicators have changed since our previous assessments in 2020 and 2018. These recent changes are also assessed in TA 2024 and included in the dashboard using ![]() to identify where an indicator assessment result has improved (e.g. from yellow to green) and
to identify where an indicator assessment result has improved (e.g. from yellow to green) and ![]() where an assessment result has worsened (e.g. from orange to red). These symbols are allocated to each indicator where a long-term and/or short-term trend has changed since the last assessment. This provides an overall assessment of change since 2020 (or 2018) as follows:
where an assessment result has worsened (e.g. from orange to red). These symbols are allocated to each indicator where a long-term and/or short-term trend has changed since the last assessment. This provides an overall assessment of change since 2020 (or 2018) as follows:
| Small improvement Either the short-term (ST) or long-term (LT) trend assessment improved | |
| Large Improvement Both the ST and LT trend assessment improved | |
| Slightly worse Either the ST or LT trend assessment worsened | |
| A lot worse Both the ST and LT trend assessment worsened |
Data disaggregation and international benchmarking
The results for the 2024 TA SDGs Progress Report are presented on this webpage. Where available, additional datasets are presented to disaggregate national averages (e.g. by gender, income, remoteness, etc.) and to provide international benchmarks for peer countries. Where available, international benchmarking includes the same set of 14 peer countries from the OECD which were selected based on similar development characteristics: Canada, Denmark, Finland, France, Germany, Japan, Rep. of Korea, Netherlands, Norway, New Zealand, Sweden, Switzerland, United Kingdom, and United States of America. The average for all OECD countries is also displayed.
Method for modelling future pathways to accelerate Australia’s progress on the SDGs by 2030 and 2050
The study design and methods for modelling future pathways for Australia are based on peer reviewed scientific research published in Nature Communications [4] and are summarised briefly here. The modelling aimed to explore two alternative post-COVID-19 recovery pathways for Australia (Figure below). A ‘Business-as-Usual Pathway’ is used as the baseline, assuming a return to pre-COVID policies and expenditure and without any additional efforts to achieve the SDGs. Contrasting this is a ‘Transform Australia Pathway’ which includes an ambitious mix of policies to accelerate six key transformations in Australia - in wellbeing, a sustainable economy, and food, energy, urban and natural systems. The alternative pathways begin to diverge in 2021 as different policy settings and assumptions are introduced.
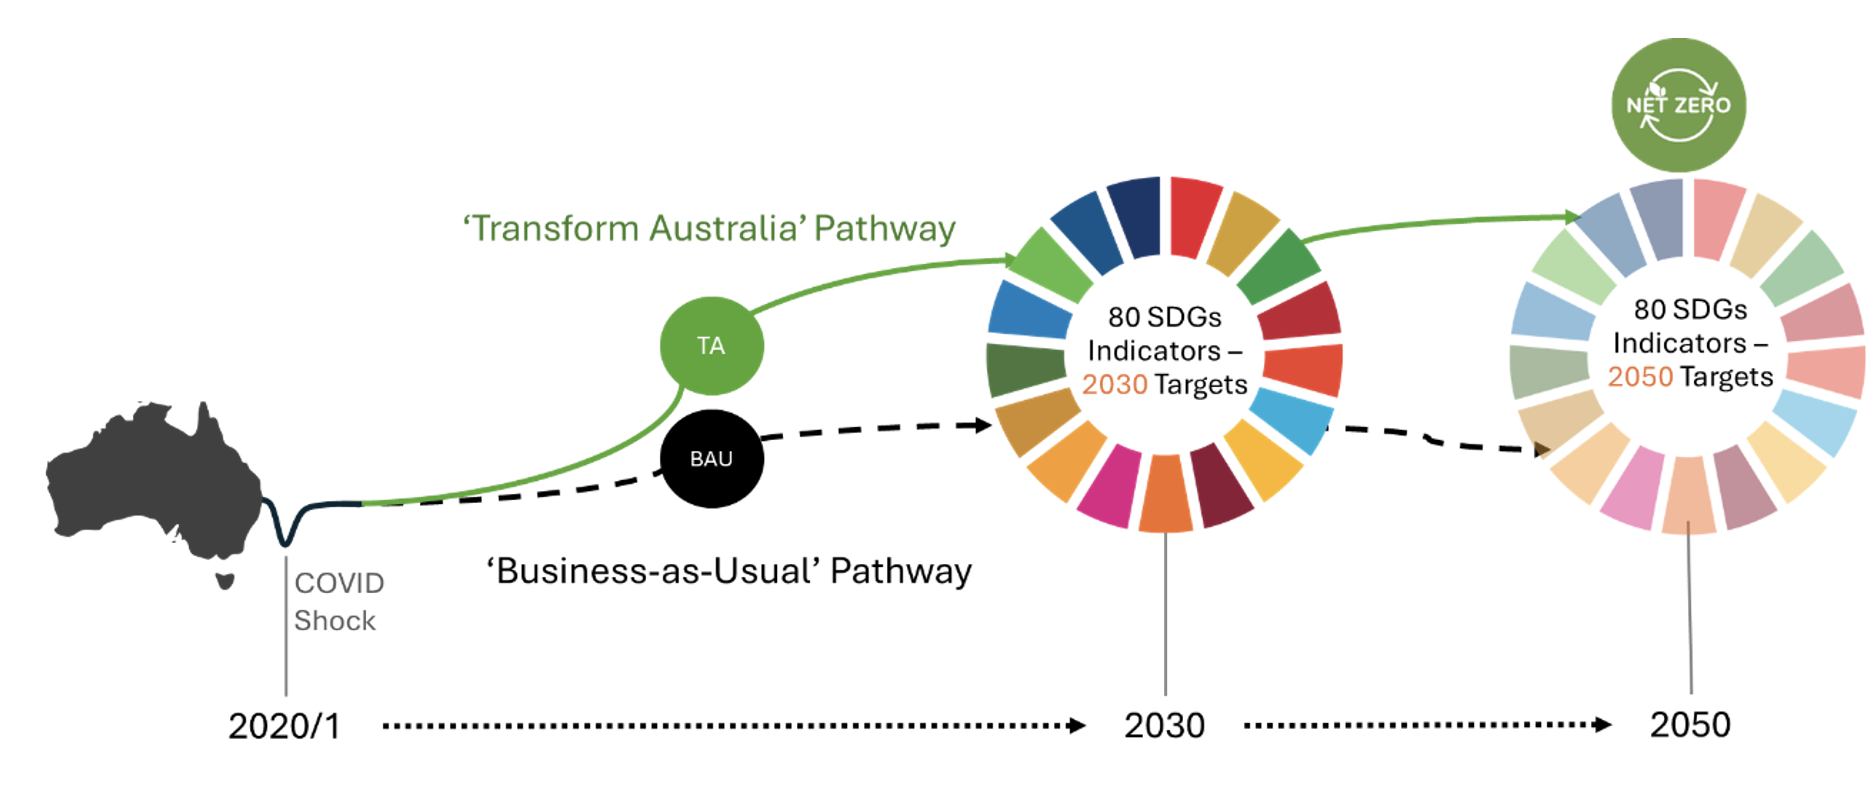
Figure 2. Modelling of two alternative future pathways for Australia and their implications for the SDGs and net zero
The 'Transform Australia pathway' assumes that a pervasive narrative emerges in Australia around the need for structural change and to ‘build back better’ using the SDGs as a roadmap. This gains support from powerful actors and coalitions which legitimises stronger policy action to accelerate six key transformations to accelerate progress towards the SDGs. The six transformations (Figure below) are based on global research that identifies six entry points with the greatest potential to achieve the SDGs [2]. Each transformation includes an ambitious package of SDGs policies from 2021 to 2030, beyond which policy settings return to trend except for net zero policy assumptions which are continued to 2050. The Pathway comprises 16 policy shifts across the six transformations (Figure 3). The ambitious SDGs policy package is intended to generate a period of accelerated progress to 2030, while longer-term settings ensure consistency with achieving net zero targets.
Further details on the modelling approach can be found here in the Technical Note.
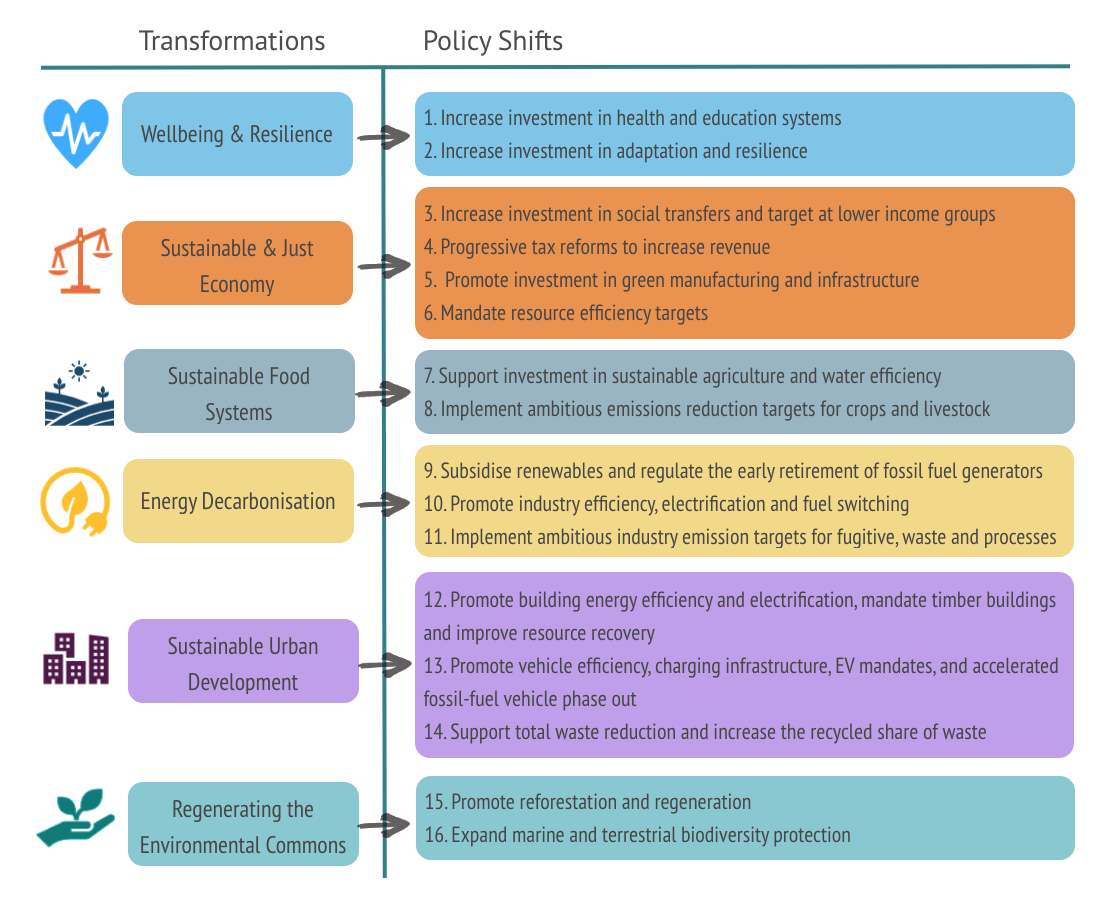
Figure 3: The ‘Transform Australia Pathway’ – six transformations and 16 policy shifts
References
1 Allen, C., et al., Assessing national progress and priorities for the Sustainable Development Goals (SDGs): experience from Australia. Sustainability Science, 2019. 15: p. 521-538 DOI: https://doi.org/10.1007/s11625-019-00711-x.
2 IGS, UN Global Sustainable Development Report (GSDR), in Report of the Independent Group of Scientists appointed by the UN Secretary-General. 2023, United Nations: New York. https://sdgs.un.org/gsdr/gsdr2023
3 Sachs, J.D., et al., Six transformations to achieve the sustainable development goals. Nature Sustainability, 2019. 2(9): p. 805-814 DOI: https://doi.org/10.1038/s41893-019-0352-9
4 Allen, C., et al., Modelling six sustainable development transformations in Australia and their accelerators, impediments, enablers, and interlinkages. Nature Communications, 2024 DOI: https://doi.org/10.1038/s41467-023-44655-4.