MASS MEDIA PUBLICITY SUPPORTING POLICE ENFORCEMENT AND ITS ECONOMIC VALUE
Paper presented to Public Health Association of
Australia 28th Annual Conference
Symposium on Mass Media Campaigns in Road Safety
30 September 1996
Mass Media Publicity Supporting Police Enforcement and its Economic Value
Max Cameron and Stuart Newstead
Monash University Accident Research Centre
ABSTRACT
The Transport Accident Commission (TAC) in Victoria has launched a number of publicity campaigns with drink-driving themes to support Police enforcement, especially the program of increased random breath testing (RBT) using highly visible "booze buses" which commenced in September 1989. The TAC has also supported the Victorian speed camera program with mass media publicity, especially on television. An evaluation of the speed camera program found statistically significant relationships between levels of TAC publicity and reductions in casualty crashes in Melbourne when other key factors were taken into account (speed camera operating hours, numbers of speeding tickets issued, and unemployment rates). The methods used in that study were also employed to examine the effects on casualty crashes of TAC publicity with drink-driving themes supporting the RBT program (monthly variations in RBT activity, alcohol sales, and unemployment rates were taken into account). The strongest effects were found when the publicity was measured by a function which represents cumulative awareness due to current and previous advertising levels. The economic value of the publicity was measured using average costs of the crashes saved and the costs of development and placement of the television advertisements. The point of diminishing returns and the benefit/cost ratio of the advertising were estimated.
1. INTRODUCTION
The research described in this paper was carried by the Monash University Accident Research Centre (MUARC) as part of evaluations of the Victorian speed camera program (including supporting publicity) and the Transport Accident Commission's (TAC) road safety television advertising. The TAC has made a major investment in road safety advertising in Victoria since 1989. Up to the end of 1992, nearly $23 million had been spent on advertising, with about 70% on television, and about $2.5 million spent to create the television advertisements. Many of the advertisements have aimed to support Police enforcement activities, including operations aimed at drink-driving such as random breath testing.
This paper describes the second part of the MUARC evaluation of the road safety benefits of TAC's television advertising campaigns (Cameron et al 1993). The first part attempted to estimate the general effects of the advertising campaigns on Victoria's road safety performance, but was unable to do this satisfactorily because of the absence of evaluations of some major road safety programs, the availability of only average effects over a number of months for those programs which had been evaluated, and the inclusion of publicity effects (including TAC road safety advertising) in the measured effects of some key programs in Victoria.
The second part built on recent MUARC evaluations of two major road safety programs which combined TAC advertising campaigns with increased enforcement efforts by the Victoria Police (i.e. the speed camera program and the program of increased random breath testing using "booze buses", both commencing near the end of 1989). Further details of the enforcement activities, supporting publicity, and assessment of their combined and individual effects are given later in this paper. An assessment of the economic value of the publicity supporting the two forms of enforcement is also described.
The third part of the project attempted to evaluate the Concentrate or Kill television campaign conducted by TAC. Concentrate or Kill differs from the speed and drink-driving advertising campaigns in that it was not designed to support enforcement. Thus the details of this part of the project are not given here, but the results can be found in Cameron et al (1993).
2. TAC ROAD SAFETY PUBLICITY CAMPAIGNS
The TAC launched its first major road safety advertising campaign on television in December 1989. Each television advertisement was launched under the banner of a general theme related to the road safety problem area targeted, and each theme had an associated slogan phrase which typically was included at the end of the corresponding advertisements (Table 1).
Table 1: Theme, slogan, name and launch date for each television advertisement launched by TAC during December 1989 to December 1992.
Theme |
Slogan |
Name |
Launch Date |
| Drink-driving | "If you drink, then drive, you're a | Lost Family | December 1989 |
| bloody idiot" | Girlfriend | December 1989 | |
| Booze Bus | September 1990 | ||
| Friends | August 1991 | ||
| Joey | November 1992 | ||
| Speed | "Don't fool yourself, speed kills" | Speed Cameras | April 1990 |
| Beach Road | April 1990 | ||
| Tracey | September 1990 | ||
| Concentration | "It's in your hands, concentrate or kill" | Country Kids | March 1991 |
| The Morgue | October 1991 | ||
| Seat Belts | "Belt up, or suffer the pain" | Bones | March 1992 |
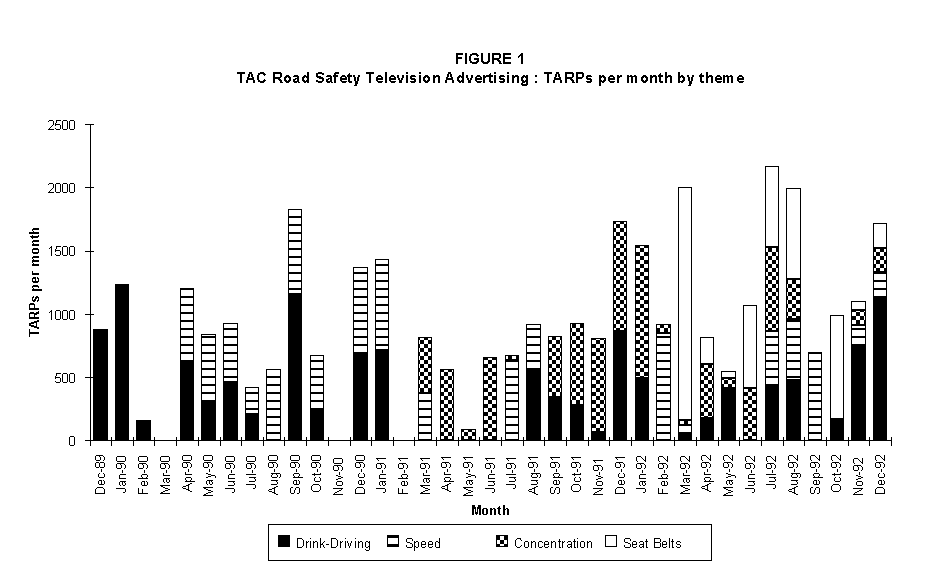
The intensity of TAC television advertising (TARPs) by theme and month to December 1992 is shown in Figure 1. TARPs (Target Audience Rating Points) is a measure of audience reach. It is a summation of the Rating Points (ie. the percentage of persons in the viewing area estimated to be watching the specific television channel at the time the advertisement was shown) for the particular Target Audience of the advertisement (ie. persons aged 18-39). However it does not describe the distribution of the number of viewings of the advertisement by each member of the Target Audience (eg. percentage having seen it zero times, once, twice, three times, etc.).
Figure 1 - TAC Road Safety Television Advertising: TARPs per month by theme
There was considerable monthly variation in the level and content of TAC television advertising (Figure 1). This variation represented an opportunity to examine the link between the TAC advertising and the monthly road safety performance in Victoria.
Television was the principal medium used by TAC for its road safety advertising throughout 1990-92. Other media used were radio, press, outdoor advertising (including mobile billboards), Sky Channel and cinema. Television advertising TARPs were planned and bought at the same level in the Melbourne and Victorian regional television areas. This implies that the intensity of the television advertising, shown in Figure 1, was approximately the same for all Victorian viewing areas during 1990-92. It was estimated that 25% of media placements of the TAC advertisements have been at no charge each year, ie. the actual number of showings was a third higher than the purchased number (however the audience reach, measured by TARPs, may not be a third higher because the free showings may not have occurred during high rating programs).
3. PUBLICITY SUPPORTING POLICE ENFORCEMENT
3.1 Publicity supporting the Speed Camera Program
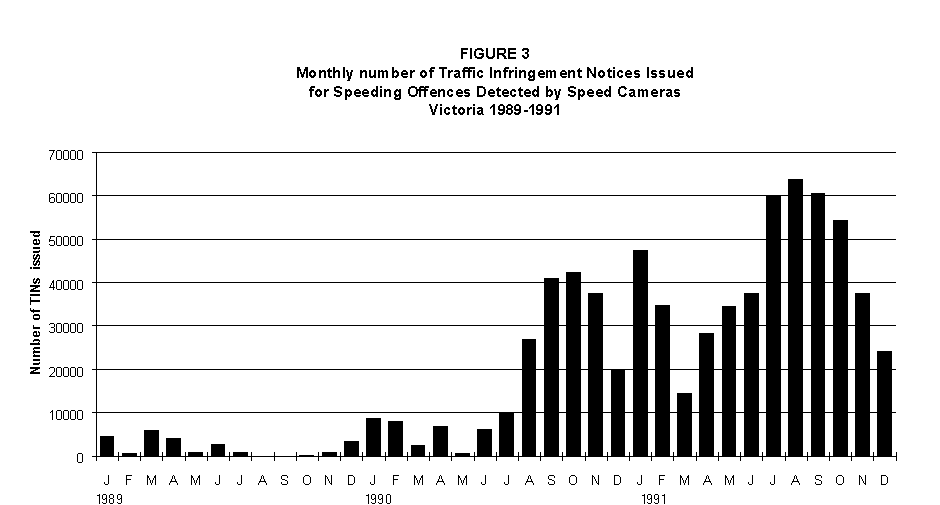
New slant radar speed cameras were progressively introduced in Victoria commencing with four in December 1989 and building to 54 by January 1991. The program included the high-exposure publicity campaign "Don't fool yourself - speed kills" launched in April 1990. From mid-1990 to December 1991 the number of Traffic Infringement Notices (TINs) issued per month for offences detected by the speed cameras varied from 14,000 to 64,000, averaging 16,100 during the second half of 1990 and 43,100 during 1991.
MUARC has evaluated the effect of the program on changes in "low alcohol hour"* casualty crashes and their severity during four periods from December 1989 to December 1991 in which there were different combinations of levels of publicity and camera activity (Cameron et al 1992a). The evaluation included a phase from April to June 1990 when there were negligible levels of camera use (after an intense 9 day burst at the beginning of April) but the television publicity continued at a high level. During this period the study showed statistically significant reductions in casualty crashes and their injury severity, of 24% and 29%, respectively, in Melbourne during the low alcohol hours of the week, and a 21% reduction in the low alcohol hour casualty crashes in rural towns (Cameron et al 1992a). These reductions were measured relative to crash experience in NSW during the same period, and after taking into account the differential changes in unemployment rates (which were found to affect travel patterns) and crash seasonality and trends in each State.
* The "low alcohol hours" of the week (ie. Monday-Thursday 6am to 6pm, Friday 6am to 4pm, Saturday 8am to 2pm, Sunday 10am to 4pm) are those periods when the percentage of drivers killed or admitted to hospital with a blood alcohol content exceeding 0.05%, was below 4%. The "high alcohol hours" are the converse of these periods, during which about 38% of driver serious casualties had blood alcohol content exceeding 0.05% (Harrison 1990).
A second stage of the evaluation linked the monthly levels of TAC television advertising (TARPs) with the variations in casualty crashes in Melbourne during low alcohol hours in 1990-91, and found statistically significant relationships for all TAC publicity and for the speed-related publicity in particular (lower level of significance). This analysis took into account the monthly variations in speed camera operating hours (Figure 2) and the speed camera TINs issued (Figure 3), the two other program variables potentially having a large effect on crashes, as well as variations in Melbourne unemployment rates and crash seasonality and trend. Thus a by-product of this evaluation was the identification of a relationship between the monthly level of TAC advertising and casualty crash reductions in Melbourne, but this had been sought and found only for low alcohol hour crashes (Cameron et al 1992a). Further details of this relationship are given in Section 4.
3.2 Publicity supporting the Random Breath Testing Program
The program of increased random breath testing (RBT) using highly visible "booze buses" commenced in September 1989. Initially there was a considerable increase in testing using four existing buses (Figure 4), which were supplemented during 1990 by the progressive introduction of 13 new buses provided by TAC to the Victoria Police for this purpose. This initiative was supported by the first of the TAC high-exposure publicity campaigns, "If you drink then drive - you're a bloody idiot", launched in December 1989. Television advertising with drink-driving themes has been a consistent part of the TAC publicity program during 1990-92. Further details of this enforcement program and supporting publicity are given by Cavallo and Cameron (1992).
Figure 2 - Monthly number of Hours of Speed Camera Operations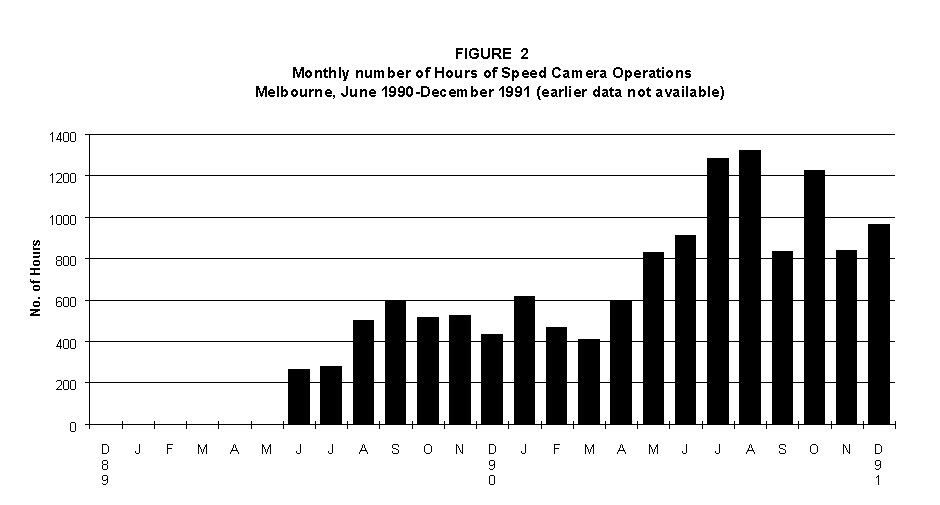
Figure 3 - Monthly number of Traffic Infringement Notices issued
A MUARC study examined changes in "high alcohol hour" (HAH) serious casualty crashes occurring in Melbourne, and in the rest of Victoria (where the program was slower to develop), during 1990 and 1991 separately (Cameron et al 1992b). Serious casualty crashes (SCCs) are those resulting in death or serious injury (usually hospital admission). The changes were adjusted for parallel changes in corresponding areas of NSW, to account for "other" factors affecting crashes apart from the effects of economic conditions, which were taken into account using trends in unemployment rates in each State. Using multivariate regression models, the analysis found the statistically significant reductions in HAH SCCs of 18% in Melbourne and 13% in rural Victoria during 1990. There was also a statistically significant reduction of 24% in rural Victoria during 1991, but the apparent 13% reduction in HAH SCCs in Melbourne during 1991 was not statistically significant.
Figure 4 - Number of Random Breath Tests per month
The analysis method linked monthly variations in the number of HAH SCCs during 1983-91 with variables representing the following:
- step effects during December 1989, during 1990, and during 1991 (the December 1989 effects were not statistically significant in any area)
- monthly unemployment rates in the corresponding area
- seasonal variation (monthly steps effects)
- long-term trend.
Unlike the Speed Camera Program Evaluation, the analysis did not include a stage where operational measures of the RBT program activity (eg. number of breath tests and levels of TAC drink-driving publicity) were included in the models instead of the step effects representing the influence of the program in Victoria for a period (eg. the step for 1990). This extension of the analysis of HAH crashes has since been carried out and is described in Section 5.
4. FORM OF THE RELATIONSHIPS USED FOR "LOW ALCOHOL HOURS"
The relationship between low alcohol hour casualty crashes in Melbourne per month and TAC advertising TARPs had been found by fitting the model for casualty crashes shown in Appendix A over the period 1983-91 (Cameron et al 1992a). It has been found in a number of studies that multiplicative (rather than additive) models fitted to the explanatory variables are best to represent road trauma series (Pascoe 1988, Hakim et al 1991, Thoresen et al 1992).
In the context of this paper, the specific model was able to take into account the monthly fluctuations (some very substantial) in those explanatory variables which were found to have significant effects on casualty crashes, so that the separate effect of the TAC advertising could be assessed. However the process assumed that the form of the model was correct, and the analysis was confined to estimating the magnitude of the exponent of each explanatory variable. In practice, the exponents were estimated by first taking logarithms of the number of casualty crashes and each of the explanatory variables, and then fitting the relationship using multiple linear regression.
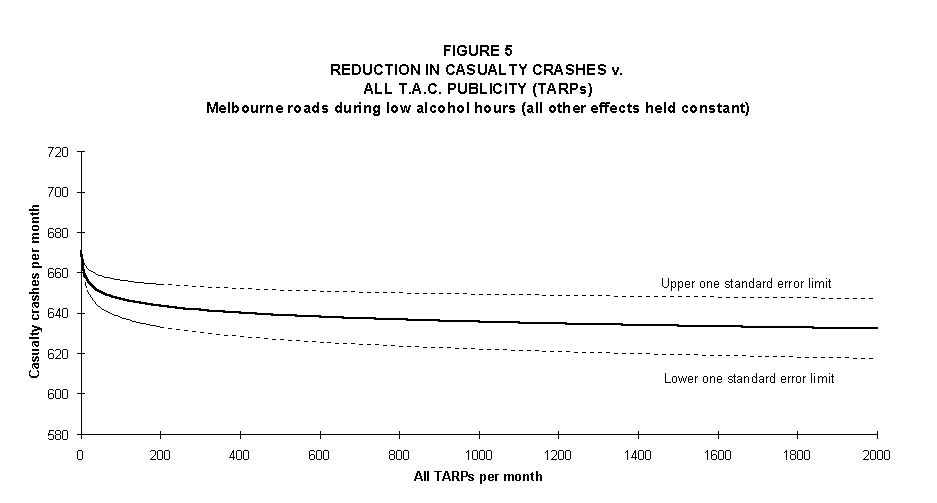
4.1 Relationship with all TAC advertising TARPs
The exponent of all TAC advertising TARPs per month was estimated to be -0.0077 with a standard error of 0.0031 (Cameron et al 1992a, Table 9) and was statistically significant (p < 0.05; two-tailed test). When all other explanatory variables in the fitted model were held constant at their average levels during December 1989 to December 1991, the form of the relationship with low alcohol hour casualty crashes in Melbourne was:
CASUALTY CRASHES PER MONTH = 670.5 (All TARPs)-0.0077.
This estimated relationship is shown in Figure 5. A relationship of this form is to be expected in this context because it is consistent with the likely diminishing returns, ie. the crash reduction per month increases at a diminishing rate as the amount of advertising increases. The range in which the true relationship could lie (with approximate 68% confidence) is indicated by the lower and upper limits calculated by adding and subtracting one standard error from the estimated exponent. The relationship in Figure 5 may not be realistic for non-zero TARPs in the range below 400 because there was only one month in 1990-91 with a TARP value in this range.
Figure 5 - Reduction in Casualty Crashes v. all TAC publicity
4.2 Relationship with "Speeding" and "Concentration" TARPs
The previously described relationship, found by Cameron et al (1992a), was between low alcohol hour casualty crashes and total TARPs from all advertising themes used by TAC, including drink-driving. It was considered unlikely that the drink-driving publicity influenced the low alcohol hour crashes, since the proportion of such crashes involving alcohol is relatively small. If so, the inclusion of the drink-driving TARPs may have masked a stronger relationship between the remaining TARPs and low alcohol hour casualty crashes.
To check this possibility the same analysis method employed by Cameron et al was used to fit the model in Appendix A, but considering only TARPs from advertising with speeding or concentration themes. The total TARPs per month with one of these themes ranged from 280 to 1150, with one month of 40 and six months with zero.
A statistically significant exponent of the speeding plus concentration TARPs was found when the model was fitted to the monthly low alcohol hour casualty crashes in Melbourne. The estimated exponent was -0.0152 with a standard error of 0.0070 (statistical significance level p < 0.05). The greater magnitude of the exponent compared with that observed when TARPs from all publicity themes were considered (Section 4.1) indicates a stronger relationship (though subject to a higher level of uncertainty because of the larger standard error of the estimate).
When the other explanatory variables were held constant at their average levels, the form of the relationship was:
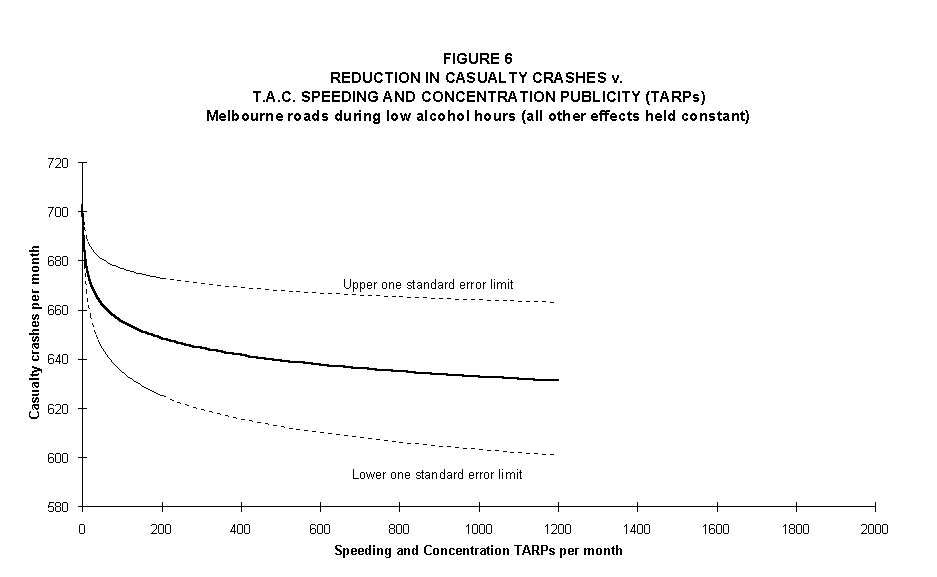
CASUALTY CRASHES PER MONTH= 702.7(Speeding & Concentration TARPs)-0.0152.
This relationship is shown in Figure 6, together with the likely range for the true relationship. The relationship is not shown for TARPs above 1200 per month, since this is outside the range of the speeding plus concentration publicity levels observed during 1990-91, and may not be realistic for non-zero TARPs below 280.
Figure 6 - Reduction in casualty crashes v TAC speeding and concentration publicity
The relationships in Figures 5 and 6 were used to estimate the point of diminishing returns for the investment in TAC television publicity per month, on average. The process compared the value of the estimated crash savings per month at each level of monthly TARPs with the cost of investing in those TARPs and is outlined in Section 7.
5. FORM OF THE RELATIONSHIPS TESTED FOR "HIGH ALCOHOL HOURS"
The form of the relationships tested between high alcohol hour (HAH) crashes and levels of TAC publicity followed that developed in the Speed Camera Program Evaluation (see Section 4). In addition, the potential effect of the publicity in each month was represented in two ways, the second method representing possible carry-over effects to subsequent months. The analysis initially considered only HAH casualty crashes, because of the known high involvement of drink-driving in these crashes, and analysed crashes in Melbourne and the rest of Victoria separately.
5.1 Multivariate regression models
Based on previous experience in evaluating the RBT program, it was decided to fit the multiplicative models shown in Appendix B to the monthly numbers of HAH crashes during 1983-92. The explanatory variables included:
- monthly unemployment rates in the corresponding area (Figure 7)
- number of random breath tests conducted in the area (Figure 4)
- an index of alcohol sales in Victoria (Figure 8, following Cameron et al 1992b)
- effect of TAC publicity (TARPs placed on television during the month, or the Adstock** of TAC television placements)
- seasonal variation (monthly steps, positive or negative)
- long-term trend.
** "Adstock" is a measure of the effect of current and past levels of advertising, which will be described in Section 5.3.
Thus the models were able to take into account the monthly fluctuations (some very substantial) in those explanatory variables which were found to have significant effects on HAH crashes, so that the separate effect of the TAC advertising could be assessed. However the process assumed that the form of the model was correct, and the analysis was confined to estimating the magnitude of the exponent of each explanatory variable.
5.2 Mechanisms of advertising effects
Television advertising placed in a given week does not necessarily produce its full effects in that week nor do its effects stop at the end of that week. Studies of advertising effects, principally of awareness of the main messages, have shown that there are delayed and carry-over effects.
Broadbent (1979) found that there is a delayed growth in awareness to peak levels when advertising is conducted at low constant levels. There is a "trigger threshold" of exposure to the advertising before most people are fully aware of the message. The consensus is that a minimum of three exposures is needed (Elliott, in preparation). This could be achieved with a minimum of 300 TARPs if they were perfectly distributed over the target audience. In practice the distribution of number of exposures per person is uneven.
Figure 7 - Unemployment rates in Melbourne and the rest of Victoria
Figure 8 - Index of alcohol sales in Victoria
Most advertisers aim to break through the trigger threshold quickly by placing a high level of advertising at the beginning of a campaign. TAC launches of a new television advertisement nearly always exceeded 300 TARPs in the first week. Thus no delayed effects of TAC publicity were expected and it was assumed that any effects on crashes commenced immediately in the week in which the advertisements were placed.
There is also quite a high level of retention of the awareness of the message of the advertising to the next and subsequent weeks, and Broadbent (1979) has found this to decay exponentially with time, ie. a constant retention factor (eg. 87%) represents the proportion of the target audience retaining awareness of the message in the next week, and then the same proportion of them in the next week, and so on. Broadbent expressed this decay function in terms of its "half-life", ie. the number of weeks after which only half the audience is aware of the message. A number of studies of "brand" advertising have found that a half-life of five weeks is very common (Broadbent 1979; Brown 1988, quoted in Broadbent 1990); this corresponds to a retention factor of approximately 87% per week.
A high level of advertising can lead to satiation of the message or "wear-out". This can occur for some individuals at even modest levels of advertising because of the imperfect distribution of exposure. For a typical weekly placement of advertising which achieves 300 TARPs, some 16% of the target audience will be exposed to the message six or more times in the week (Elliott, in preparation). One way of minimising wear-out is to create more than one advertisement and to rotate them in a pool.
5.3 Adstock
"Adstock" is a concept developed by Broadbent (1979) to represent the effects on awareness of current and past advertising. It is the cumulation of the TARPs in the current week with the decayed effects (applying a specific retention factor) of the TARPs placed in each previous week. Thus Adstock is "cumulative, decayed ratings ... and so represents the amount of advertising current at the time" (Broadbent 1990).
Adstock (using a half-life of five weeks) was calculated from the weekly levels of advertising placed by TAC to represent the total effect in each week of TAC's current and past advertising. In essence, it represents the total TARP effect on awareness considered to be given to or retained by the target audience during a specific week.
The calculations were made for each theme of the TAC advertisements as well as the total, and then grouped into each month during December 1989 to December 1992 (Adstock during a week spanning two months was distributed pro-rata over the months). Total Adstock showed an increasing but fluctuating trend during 1990-92 (Figure 9), with no month having a zero level (compare with raw TARPs per month in Figure 1).
VicRoads (in conjunction with TAC) placed a substantial level of anti-drink-driving advertisements on Victorian television during November 1989, achieving 430 TARPs for audiences in the 16-24 year old age group in Melbourne. For the purpose of the analysis described in the following section, the decayed levels of these drink-driving TARPs were added to those achieved by TAC placements commencing in December 1989.
Figure 9 - TAC road safety televsion advertising - monthly adstock by theme
5.4 Crash types analysed
Initially the analysis considered only serious casualty crashes (SCCs) during HAHs because of the high involvement of drink-driving in these crashes, the known effects of the Random Breath Test Program on this crash type (Cameron et al 1992b) and the likelihood that previously developed models could be extended (see Section 3.2). Subsequently it was found that the results extended to non-serious casualty crashes and then to all casualty crashes during HAHs (Cameron et al 1993). Only the results for all HAH casualty crashes are reported here.
Separate analyses were conducted for HAH crashes which occurred in Melbourne and in the rest of Victoria. The unemployment rates and monthly random breath tests used as explanatory variables were those which occurred in each specific area. The index of alcohol sales was available only for total Victoria and was used in each of the two areas. The intensity of TAC television advertising, measured by TARPs per week, was considered to be equally applicable in the two areas (see Section 2).
The effects of the television publicity were represented both in terms of raw TARPs in each month and by the calculated Adstock for the month (see Section 5.3). TARPs and Adstock specifically for drink-driving themes were considered as well as those for all themes. The drink-driving publicity was considered likely to have had direct effects (if any) on crashes during the high alcohol hours, when crashes involving drink-driving are most common. However, monthly TARPs from publicity of all themes had been shown to have a statistically significant relationship with low alcohol hour crash levels in the Speed Camera Program Evaluation, whereas for the speed-related TARPs the relationship was only marginally significant. For this reason, levels of TAC publicity of all themes were also specifically considered in the analysis.
In general, the strongest relationships between monthly variations in HAH casualty crashes and levels of publicity were found when drink-driving Adstock was used (Cameron et al 1993). For this reason, only the results for models incorporating drink-driving Adstock are reported here.
6. RELATIONSHIPS FOUND FOR HIGH ALCOHOL HOUR CRASHES
The model given in Appendix B was fitted to the explanatory variables to explain the monthly variations in HAH casualty crashes in Melbourne during 1983-92. This was done by taking logarithms of the crash numbers and each explanatory variable, and then fitting the model by multiple linear regression. The model explained 89% of the monthly variation in HAH casualty crashes. The estimated exponent of drink-driving Adstock was very highly statistically significant (Table 2). The estimated coefficients and statistical significance of the other factors included in the model are given by Cameron et al (1993).
Table 2: CASUALTY CRASHES (High alcohol hours of the week). Effects of TAC Drink-Driving Publicity (Adstock in the month), by Region of Victoria.
REGION |
Estimated Exponent of
Drink-Driving Adstock |
| Melbourne | -0.0169*** |
| Country Victoria | -0.0379*** |
*** Very highly statistically significant at p<0.001 level
The model fitted to country HAH casualty crashes explained 69% of the monthly variation in these crashes. The Adstock of the drink-driving publicity was very highly statistically significant (Table 2). Further details of the fitted model are given by Cameron et al (1993).
The forms of the relationships with HAH casualty crashes (CCs), when all other explanatory variables were held constant at their average levels, were:
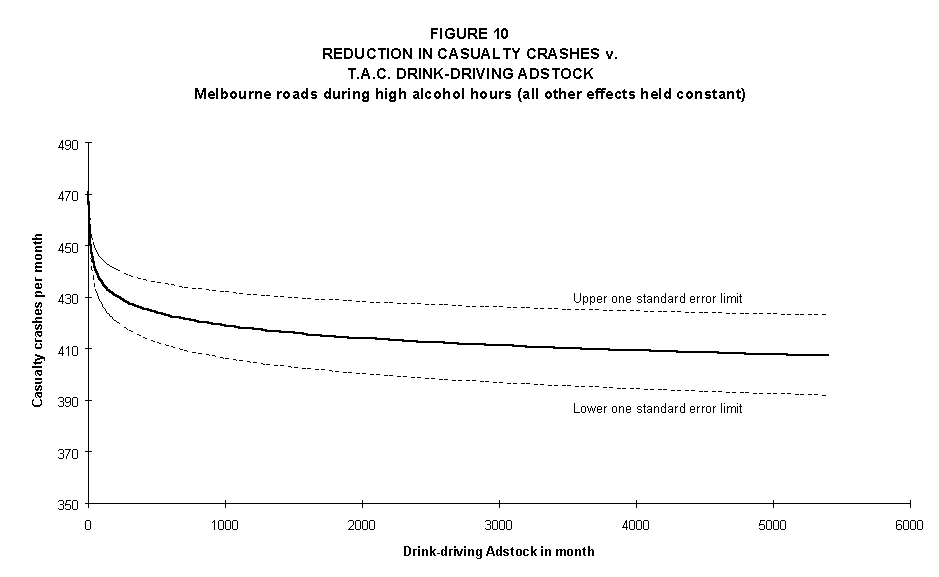
MELBOURNE HAH CCs PER MONTH = 470.9 (Adstock)-0.0169
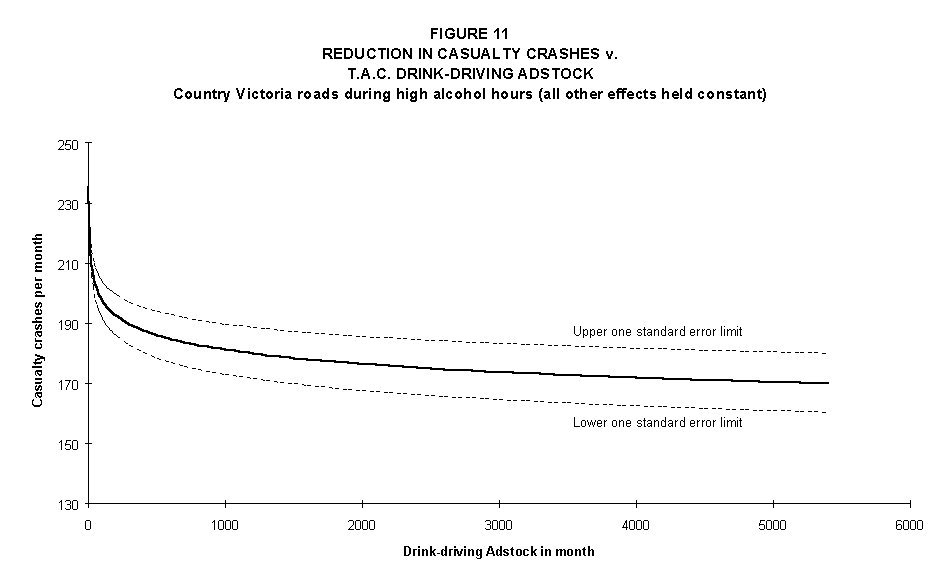
COUNTRY VICTORIA HAH CCs PER MONTH = 235.2 (Adstock)-0.0379.
These relationships are shown in Figures 10 and 11 respectively. The upper and lower limits are the range in which the true relationship could lie with approximate 68% confidence.
Figure 10 - Reduction in casualty crashes v TAC drink-driving adstock
Figure 11 - Reduction in casualty crashes v TAC drink-driving adstock - country
7. ECONOMIC ANALYSIS
7.1 Economic analysis of effects on low alcohol hour crashes
7.1.1 Valuing the road safety benefits
For a given level of TARPs per month, the relationship in Figure 5 or 6 can be used to estimate the monthly number of casualty crashes expected to occur, assuming that all other influences are constant. Subtracting this from the expected number in a month with zero publicity gives the expected saving in casualty crashes which would be achieved by investing in the specific number of TARPs.
The value of this expected saving can be estimated by multiplying it by one of the following average values of a casualty crash:
(a) Average TAC payments per casualty crash, measured by the average TAC payments per injury compensation claimant, multiplied by the average number of such claimants per casualty crash. TAC have provided estimates of the average lifetime cost of a claim (with future costs in excess of average weekly earnings discounted at 3.5% p.a.) as $24,148 from 14,570 "No-fault" claims, and $13,919 from 4,011 WorkCover claims, from crashes in Victoria during 1990/91 (expressed in December 1992 dollars). The weighted average of lifetime costs from these two types of claims is $21,940. TAC also advised that 1.32 claims per Police reported casualty crash during 1990/91 had been received by the end of March 1993. These figures were used to estimate that the average lifetime cost of TAC claims per Police reported casualty crash occurring during 1990/91 was $28,960 in December 1992 dollars.
(b) Average social cost per casualty crash, based on an estimate made by the Bureau of Transport and Communications Economics (Steadman and Bryan 1988) using the social human capital approach for accident costing (using a 4% discount rate). VIC ROADS (1992) have used this to estimate that the average cost of a casualty accident in Melbourne was $57,000 in 1991 dollars. This figure was updated using the Consumer Price Index to produce an estimate of $58,040 in December 1992 dollars.
7.1.2 Cost of TAC road safety advertising
The cost of TAC television advertising is made up of essentially two major components:
(a) the fixed cost of developing each television advertisement, made up of concept research and production costs
(b) the cost of media placement, measured as the cost per TARP paid by TAC.
In addition, TAC road safety themes and messages have been promoted through radio, press and outdoor advertising. No information was available on the monthly levels and costs of publicity placed in these media, but the total cost was estimated to be 29-30% of the total media placement budget during 1990-92 (Harper 1991, 1993). However the costs of this supporting publicity could not be ignored, as such publicity is considered an important supplement to the television advertising. Because of this the supporting publicity in other media was included in the fixed costs.
Fixed costs
Grey Advertising provided the research and production costs paid by TAC for each television advertisement developed since 1989. These costs were indexed to December 1992 dollars so that they are comparable with the bases for valuing the road safety benefits (see Section 7.1.1). Only the advertisements launched during the period to December 1991 were considered.
The development costs provided the basis for campaigns which extended over many months during the period. In order to distribute these fixed costs over the periods when the advertisements were placed in the media, the total cost to develop the advertisements for each theme was divided by the number of months in which the theme was used (Table 3). It should be noted that this process produces relatively high figures for the "Concentration" advertisements because they were both launched during 1991 and hence they were used in relatively fewer months up to December 1991 compared with the advertisements with the other two themes.
Table 3: Development costs of TAC road safety advertisements averaged over the months in which they were used during December 1989 to December 1991.
Theme |
Total Development Costs (Dec. 1992 dollars) |
No. of Months Theme Used During Dec. 1989 - Dec. 1991 |
Average Development Cost per Month of Use |
| Drink-Driving | $550,700 |
15 |
$36,710 |
| Speeding | $492,100 |
12 |
$41,010 |
| Concentration | $536,800 |
8 |
$67,100 |
| Total for Speeding and Concentration Themes | $1,028,900 |
20 |
$51,450 |
| TOTAL FOR ALL THEMES | $1,579,600 |
35 |
$45,130 |
A mark-up factor was developed to reflect the additional fixed costs of the use of other publicity media to support the television advertisements. Harper (1991, 1993) provided data which allowed an estimate of the total cost of TAC publicity in media other than television as $6.70 million during 1990-92 (actual dollars). The total cost of development of all TAC television advertisements launched during 1990-92 was $2.434 million (actual dollars). Thus a mark-up factor of 3.75 (= 6.70/2.434) was derived to reflect the typical costs of supporting media placements to be added to the television advertisement development costs.
While this method of taking into account the costs of supporting media makes questionable assumptions, it should be noted that the estimated fixed costs per month were relatively small compared with the television media placement costs and thus the chosen method should not lead to significant distortions.
Television media placement costs
Grey Advertising were unable to provide information on the cost of media placement in the form required, namely the cost per TARP paid by TAC for placements in the Melbourne television viewing area during 1989-91. However they were able to provide the number of TARPs for persons aged 18-39 achieved on Melbourne and country Victoria television for each week from December 1989 to mid-April 1993, by theme and name of advertisement.
TARPs is a summation of the Rating Points (ie. percentage of persons in the viewing area estimated to be watching the specific television channel at the time the advertisement was shown) for the particular Target Audience of the advertisement (eg. persons aged 18-39). When multiplied by the number of the Target Audience living in the viewing area, it represents an estimate of the total number of "person-viewings" of the advertisement.
The size of the population in the viewing area, as well as the Rating Points expected, determines the cost of placing the advertisement with a specific television channel, program and time-slot. Grey Advertising said that throughout the period since December 1989 they had planned and bought equal TARPs "weightings" in Melbourne and country Victoria. An industry agreement ensures that the cost per thousand of the population reached in the two areas is about the same for an advertisement placed in a time-slot with given Rating Points, but of course the cost of placement on a Melbourne television channel is greater because of its larger viewing area compared with a country channel or network. Thus the total cost of placements on Melbourne television would have been much greater than placements on country television.
It should also be noted that the cost of a single placement of a television advertisement varies with its length (15, 30 or 60 seconds are typical) and the month in which it is shown (October and November are the most expensive months, whereas January and February are least expensive). Grey Advertising has advised that the majority of TAC advertisement showings were for 60 seconds. This would attract the same TARP score as a 30 second advertisement showing at the same time. Thus the cost per TARP of the TAC advertisements can be expected to be relatively high, but the exposure of the audience to its message is on average twice as long as normally achieved with 30 second advertisements.
Harper (1991, 1993) provided aggregate information on the total cost of placement of TAC road safety advertising in all media. Coupled with the data provided on the number of TARPs achieved, this information allowed an estimate of the average cost per TARP achieved by TAC advertisements on Victorian television for each of the years 1990-92 (Table 4).
Table 4: Calculation of average cost per TARP paid by TAC for road safety television advertising in Victoria during 1990, 1991 and 1992.
| Year | Media Budget* ($m.) | Television component* (%) | Television Placement Expenditure ($m.) | Total TARPs Achieved | Average Cost per TARP (Dec. 1992 dollars) | |
| Actual | Indexed to Dec. 1992 | |||||
1990 |
5.5 |
70 |
3.85 |
4.05 |
9413 |
430 |
1991 |
7.85 |
71 |
5.57 |
5.67 |
9342 |
607 |
1992 |
9.56 |
71 |
6.79 |
6.83 |
15497 |
441 |
* Extracted from Harper (1991, 1993) - submissions to AFA Advertising Effectiveness Awards
Table 4 shows that the estimated average cost per TARP has varied substantially over the three years. Grey Advertising cautioned that media prices had varied considerably during 1990-92 and emphasised that the rates obtained had been "as negotiated by the Agency" (presumably these reflected the relatively high level of TAC advertising placements).
The figures in Table 4 represent the television placement costs to achieve the TARP levels on all Victorian television, not just Melbourne television. In Sections 7.1.3 and 7.1.4 it is conservatively assumed that all of the placement costs were due to Melbourne placements. In addition it is assumed that the average cost per TARP for the TAC advertisements up to December 1991 is the weighted average of the 1990 and 1991 figures in Table 4, ie. $518 per TARP.
7.1.3 Method of economic analysis
The value of the estimated casualty crash savings per month for each level of TARPs placed (up to a maximum of 2000 TARPs per month), and the cost of investing in those TARPs, was calculated. The incremental saving in casualty crash costs for each increase in the investment in TARPs (say, from 400 to 410 TARPs per month) was also calculated, and then divided by the incremental cost of the TARPs, to produce a marginal Benefit/Cost Ratio (BCR).
As expected from the shape of the relationships in Figures 5 and 6, the incremental savings fell with each incremental investment in TARPs. At the point where an extra investment no longer returns benefits which out-weigh the cost, the marginal BCR falls below one. This "point of diminishing returns" depends on the method used to value the casualty crash savings, and the specific types of publicity considered in the relationships with low alcohol hour casualty crashes in Melbourne (see below).
At each point of diminishing returns, representing the point where further investment in TARPs per month (on average) is no longer justified by the value of the additional crash savings, the BCR of the program of investment in advertising (at the specific level of TARPs) was also calculated. To fully account for the costs of the program of advertising (including supporting media), the fixed costs averaged over the months of use of the television advertisements were added to the TARPs costs. The fixed costs were the average development costs (Table 3) multiplied by the mark-up factor (see Section 7.1.2) to represent the cost of supporting publicity. These costs were then divided into the value of the total crash savings per month achieved by the specific level of TARPs, to calculate the BCR of the investment at that level.
7.1.4 All TAC road safety advertising themes
Table 5 shows the level of TAC publicity per month which was found to be the approximate maximum investment (to the nearest 10 TARPs) before the marginal BCR fell below one, for each of the two methods for valuing the casualty crash savings. The lower limit of TARPs is the point of diminishing returns for the upper limit of the relationship shown in Figure 5, whereas the upper limit of TARPs corresponds to the lower limit of the relationship (the true point can be expected to lie between these limits with approximately 68% confidence). The program BCR at the central estimate of TARPs includes fixed costs averaged at $169,200 per month over the months during December 1989 to December 1991 in which the advertisements were screened.
Table 5: Point of Diminishing Returns for Effects of All TAC Publicity Themes on Low Alcohol Hour Casualty Crashes in Melbourne, December 1989 to December 1991.
Valuation of Casualty Crash Savings |
Maximum
investment in TARPs per month which produces marginal BCR
just greater than one |
Program BCR for TARPs per month at level of the Estimate | ||
Lower Limit |
Estimate |
Upper Limit |
||
| Average TAC Lifetime Payment per Casualty Crash ($28,960) | 170 |
280 |
380 |
2.6 |
| Average Social Cost per Casualty Crash ($58,040) | 340 |
560 |
760 |
4.0 |
Note: Italicised figures are less reliable and should be used with caution because they lie outside the range of TAC road safety TARPs per month most commonly achieved on Melbourne television during 1989-91.
7.1.5 "Speeding" and "Concentration" TAC road safety advertising themes
The relationship between the "speeding" and "concentration" publicity levels, and the reduction in low alcohol hour casualty crashes, was stronger than that observed for all publicity themes, but subject to higher levels of uncertainty (refer Section 4). Table 6 shows that the estimated point of diminishing returns, for a given method of valuing the casualty crash savings, is always higher than that shown in Table 5, but the range between the upper and lower limits is substantially wider. The program BCRs include fixed costs averaged at $192,900 per month over the months during April 1990 to December 1991 in which the advertisements with these two themes were screened.
Table 6: Point of Diminishing Returns for Effects of TAC "Speeding" and "Concentration" Publicity Themes on Low Alcohol Hour Casualty Crashes in Melbourne, April 1990 to December 1991.
Valuation of Casualty Crash Savings |
Maximum
investment in TARPs per month which produces marginal BCR
just greater than one |
Program BCR for TARPs per month at level of the Estimate |
||
Lower Limit |
Estimate |
Upper Limit |
||
| Average TAC Lifetime Payment per Casualty Crash ($28,960) | 310 |
540 |
750 |
3.9 |
| Average Social Cost per Casualty Crash ($58,040) | 610 |
1080 |
1490 |
5.4 |
When the benefits were valued in terms of reduced TAC payments, the point of diminishing returns for "speeding" and "concentration" TARPs was estimated to be 540 TARPs per month on average. At this level of investment in monthly publicity levels on average, the program of investment (including the fixed costs) was estimated to return benefits of reduced TAC payments at a level 3.9 times the investment costs. It was also estimated to result in a reduction of the monthly levels of low alcohol hour casualty crashes in Melbourne of 9% on average.
It should be noted that if a lower level of monthly TARPs was used than the point of diminishing returns, the program BCR would be higher, but the reduction in monthly casualty crashes would be less (as determined by the shape of the curve in Figure 6).
When the savings in casualty crashes were valued by their average social costs, the estimated point of diminishing returns was 1080 TARPs per month on average. A program of investment in "speeding" and "concentration" publicity at this level was estimated to return social benefits of 5.4 times the investment costs, and to result in a 10% reduction in monthly numbers of low alcohol hour casualty crashes in Melbourne on average.
7.2 Economic analysis of effects on high alcohol hour crashes
An economic analysis of the savings in casualty crashes estimated by the relationships derived in Section 6 was conducted. Essentially the same data and methods were used as in the economic analysis of the effects of TAC publicity on low alcohol hour casualty crashes in Melbourne (see Section 7.1), with minor variations described in the following sections.
7.2.1 Valuing the reductions in casualty crashes
The expected savings in casualty crashes at each specific monthly level of drink-driving Adstock were valued by multiplying them by the following:
(a) Average TAC payments per casualty crash, previously estimated as $28,960 in December 1992 dollars (Section 7.1.1).
(b) Average social cost per casualty crash, which had also been previously estimated as $58,040 for crashes in Melbourne (Section 7.1.1). The same method and source (VIC ROADS 1992) was used to estimate the average social cost of casualty crashes in country Victoria as $91,640 in December 1992 dollars.
7.2.2 Costs to achieve TAC publicity levels (Adstock)
It was necessary to estimate the fixed costs of the drink-driving advertisements (averaged over their months of use) and also the cost to achieve each unit of drink-driving Adstock, on average, during the period to December 1992.
Fixed costs
The total development costs for concept research and production of the drink-driving advertisements launched by TAC to the end of 1991 represented $550,700 in December 1992 dollars (Table 3). Only one drink-driving advertisement ("Joey") was launched during 1992, but this was in November so it was not considered appropriate to include its relatively high development cost ($425,200) with those of the other advertisements used during 1990-92. The other drink-driving advertisements were used during 23 months to October 1992, so their average development cost per month of use was $23,940 in December 1992 dollars.
The mark-up factor to reflect the costs of supporting publicity (see Section 7.1.2) was applied to the average development cost of the drink-driving advertisements. It was estimated that the total fixed cost of these advertisements (and their support) averaged $89,850 per month of use (in December 1992 dollars).
Television media placement costs
Information provided by Grey Advertising had allowed calculations of the average cost per TARP paid by TAC for road safety advertising on Victorian television during 1990, 1991 and 1992 (Table 4). The weighted average of these costs was $483 per TARP in December 1992 dollars.
The awareness of a television advertisement placed in a given week will be retained, but decayed somewhat, during the following weeks. Adstock is a function of the TARPs achieved which reflects their immediate and (decayed) future value in terms of awareness. In Section 5.3, Adstock was calculated assuming a "half-life" of five weeks for the decay. On this basis, 100 TARPs placed in a given week represents a total Adstock of 769 during the current and subsequent weeks.
This figure was used to calculate that the cost per Adstock achieved by the TAC advertisements was approximately $63 in December 1992 dollars. It was also used to convert the monthly investments in TARPs into Adstock, for the purpose of calculating the estimated savings in casualty crashes in the following economic analysis. However, it should be noted that a given level of Adstock in a month can be achieved by a number of different weekly patterns of TARP placements (including higher levels at the beginning of a campaign).
7.2.3 Economic analysis of "Drink-Driving" publicity levels
The following analysis relates to average monthly levels of TARPs which, if placed evenly from week to week, would achieve Adstock levels determined by a constant multiplier (ie. 7.69). In practice, TAC and other advertisers seldom place their television advertisements at an even level, for various strategic reasons. However the carry-over of residual awareness to subsequent periods (as measured by Adstock) results in awareness levels being more even than the actual placements would suggest.
The same methods of economic analysis as described in Section 7.1.3 were used. The savings were calculated for Melbourne and country Victoria crashes separately, and then added together. The point of diminishing returns was calculated for the investment in drink-driving publicity per month on average (Table 7).
Table 7: Point of Diminishing Returns for Effects of TAC Drink-Driving Publicity on All Casualty Crashes during High Alcohol Hours in Victoria, 1989-92.
Valuation of Casualty Crash Savings |
Maximum investment
in TARPs per month on average which produces marginal BCR
just greater than one ("Point of Diminishing Returns") |
Program BCR for average TARPs per month at level of the Estimate |
||
Lower Limit |
Estimate |
Upper Limit |
||
| Average TAC Payment per Casualty Crash (CC): $28,960 | 660 |
800 |
930 |
7.9 |
| Av. Social Cost per CC - Melbourne: $58,040 - Country: $91,640 |
1670 |
2000 |
>2000 |
10.1 |
Note: Italicised figures are less reliable and should be used with caution because they lie outside the range of TAC drink-driving TARPs per month most commonly achieved on Victorian television during 1989-92.
When the benefits were valued in terms of reduced TAC payments, the point of diminishing returns for drink-driving TARPs was estimated to be 800 TARPs per month on average. At this level of investment in monthly publicity levels on average, the program of investment (where the fixed costs of developing the television advertisements, plus the costs of supporting media, are included) was estimated to return benefits of reduced TAC payments at a level 7.9 times the investment costs. It was also estimated to result in a reduction of the monthly levels of high alcohol hour casualty crashes of 18.5% on average. It should be noted that if a lower level of monthly TARPs was used than the point of diminishing returns, the program BCR would be higher, but the reduction in monthly casualty crashes would be less.
When the savings in casualty crashes were valued by their average social costs, the estimated point of diminishing returns appeared to be about 2000 drink-driving TARPs per month. Since 2000 drink-driving TARPs per month is well outside the range of experience with the TAC advertisements, it would unwise to conclude that the true point of diminishing returns lies in this range (when average social costs are used to value the crash savings). At these levels of advertising, with a single theme (ie. drink-driving), it is possible that satiation of the message or "wear-out" may occur and the advertisements may not be as effective as indicated by the relationships established in Section 6 for lower levels of drink-driving publicity. Thus the point of diminishing returns for drink-driving TARPs per month is uncertain in this case.
8. DISCUSSION
8.1 Low alcohol hour crashes in Melbourne
A relationship between the monthly levels of TAC television advertising (all themes) and the reductions in low alcohol hour casualty crashes in Melbourne was originally found as part of an evaluation of the Speed Camera Program (enforcement and publicity). The study reported here found a stronger relationship between the same type of crash reductions and the monthly levels of publicity with "speeding" or "concentration" themes, using the same methods of analysis as the earlier evaluation. It is possible that the earlier inclusion of "drink-driving" publicity may have partially masked the effect on low alcohol hour crashes, which are likely to have relatively low levels of alcohol involvement and hence are unlikely to be influenced by this type of publicity.
While the relationship with the monthly levels of "speeding" or "concentration" publicity is stronger, it is also subject to higher levels of uncertainty. Nevertheless, the mechanism of the effects on the low alcohol hour crashes appears more likely to be related to these themes than to the TAC publicity of any type.
8.2 High alcohol hour crashes in Melbourne and country Victoria
The experience developed in gaining an understanding of the effect mechanisms of the Speed Camera Program suggested that the same analysis methods may be used to investigate the existence of relationships between high alcohol hour crashes and TAC advertising levels, especially advertising with drink-driving themes. While the methods involve a number of assumptions, in general they have been found to be reasonable ones in the context of trends in road trauma numbers.
Two independent analyses have demonstrated a link between monthly levels of TAC drink-driving advertising on television (measured by the Adstock of current and previous advertising) and reductions in crashes during the high alcohol hours of the week. Statistically significant relationships were found with casualty crashes in both Melbourne and country Victoria, after monthly variations in a number of other major explanatory variables were taken into account. This replication of essentially the same finding suggests that the evidence for a link is robust.
However it should be noted that a high level of television advertising at the beginning of a new campaign may be necessary to achieve these effects. The TAC launches of each new advertisement had this characteristic, which may be an essential part of establishing in real life the relationships between publicity levels and casualty crash reductions observed in the study.
8.3 General remarks
The results of the project confirmed those of many other studies which have examined road safety programs which combine Police enforcement and publicity regarding the enforcement activity or the danger of the behaviour being enforced. Elliott (1993), when reviewing available literature on the effects of road safety mass media campaigns, found that the combination of publicity and enforcement is more effective than other campaigns. It would seem that the simultaneous enforcement of the behaviour being publicised adds to the incentive of the audience to respond to the publicity and to change their behaviour appropriately.
Another part of the project was unable to find reliable evidence of a positive effect of the Concentrate or Kill campaign, except that it appeared to increase awareness of the need for drivers to concentrate (Cameron et al 1993). Notwithstanding the difficulties in conducting an evaluation of this campaign, there is a suggestion that its effects were relatively small. This campaign has the disadvantage that the behaviour it aims to promote is not one that can be legislated nor enforced.
9. CONCLUSIONS
In general, the research indicates clear links between levels of TAC publicity supporting the drink-driving and speeding enforcement programs and reductions in casualty crashes when other major factors are held constant.
The conclusions related to the point of diminishing returns depend on whether the costs of TAC's road safety television advertising are viewed as an investment to reduce TAC payments to injury claimants or to reduce the social costs of casualty crashes (the social costs include the value of future productivity forgone, pain and suffering, and damage to vehicles and property).
Return on investment to reduce TAC lifetime payments to injury claimants
When other major factors were taken into account, it was found that monthly levels of "speeding" or "concentration" publicity on Melbourne television were associated with reductions in casualty crashes during the "low alcohol hours" of the week in Melbourne during 1990-91. An investment of 540 TARPs per month on average in publicity with these themes was estimated to be economically justified before diminishing returns occurred. This level of average investment could lie in the range from 310 to 750 TARPs per month (with 68% confidence). An investment of 540 TARPs per month (plus necessary fixed costs to develop the television advertisements used, as well as for supporting publicity in other media) is estimated to return benefits of reduced TAC payments at a level 3.9 times the investment costs.
When other major factors were taken into account, it was found that monthly levels of "drink-driving" publicity on Victorian television were associated with reductions in casualty crashes during the "high alcohol hours" of the week in 1990-92. An investment of 800 TARPs per month on average in drink-driving publicity was conservatively estimated to be economically justified before diminishing returns occurred. This level of average investment could lie in the range from 660 to 930 TARPs per month (with 68% confidence). An investment at an average level of 800 TARPs per month (plus necessary fixed costs) is estimated to return benefits of reduced TAC payments at a level 7.9 times the investment costs.
In both cases, even higher benefit/cost ratios would be realised if lower levels of TARPs per month were used, but the expected reduction in casualty crashes would be less.
Reduced social costs of casualty crashes
An investment of 1080 TARPs per month on average in "speeding" or "concentration" publicity on Melbourne television was estimated to be economically justified before diminishing returns occurred. This level of average investment could lie in the range from 610 to 1490 TARPs per month (with 68% confidence; the latter figure also being a less reliable estimate). An investment of 1080 TARPs per month (plus necessary fixed costs) is estimated to return benefits of reduced social costs of crashes at a level 5.4 times the investment costs.
It was not possible to reliably estimate the point of diminishing returns for the investment in "drink-driving" publicity if the casualty crash savings were valued by their average social costs, except that it would be considerably higher than the corresponding level based on TAC payments.
10. ASSUMPTIONS
The results described in this paper were based on the following major assumptions:
(a) The form of the relationships fitted to monthly numbers of casualty crashes occurring in Victoria during the "low" and "high" alcohol hours, respectively, in 1983-92 was correct (see Appendices A and B, respectively).
(b) The explanatory variables included (where appropriate, considering the time of week of the crashes being modelled) in the fitted relationships in addition to levels of TAC road safety television publicity (measured by TARPs and Adstock), namely monthly levels of speed camera operating hours, speed camera TINs issued, random breath tests, alcohol sales, unemployment rates, trend and seasonality variables, did not omit any other major variables with substantial effects on casualty crashes during the corresponding periods of the week.
(c) The correlations between monthly levels of TAC television publicity and other variables included in the fitted relationships did not have a major effect on the estimates of the publicity impacts.
(d) The decay in awareness of the road safety messages from the television advertising follows a negative exponential function with a half-life of five weeks.
(e) The cumulative awareness of current and previous advertising, considered to be measured by Adstock, did not reach a level where satiation of the messages or "wear-out" occurred in any month during 1989-92, resulting in a relatively low level of effectiveness of the advertisements compared with expected.
11. ACKNOWLEDGEMENTS
The work described in this paper was carried out under the sponsorship of the Transport Accident Commission and as part of the baseline research program of the Monash University Accident Research Centre. The views expressed in the paper are those of the authors and not necessarily those of Monash University or the Transport Accident Commission.
References
BROADBENT, S (1979), "One way TV advertisements work". Journal of the Market Research Society, Vol. 21, No. 3. London.
BROADBENT, S (1990), "Modelling beyond the blip". Journal of the Market Research Society, Vol. 32, No. 1. London.
CAMERON, MH, CAVALLO, A, and GILBERT, A (1992a), "Crash-based evaluation of the speed camera program in Victoria 1990-91. Phase 1: General effects. Phase 2: Effects of program mechanisms". Report No. 42, Monash University Accident Research Centre.
CAMERON, MH, CAVALLO, A, and SULLIVAN, G (1992b), "Evaluation of the random breath testing initiative in Victoria 1989-91: Multivariate time series approach". Report No. 38, Monash University Accident Research Centre.
CAMERON, MH, HAWORTH, N, OXLEY, J, NEWSTEAD, S and LE, T (1993), "Evaluation of Transport Accident Commission road safety television advertising". Report No. 52, Monash University Accident Research Centre.
CAVALLO, A, and CAMERON, MH (1992), "Evaluation of a random breath testing initiative in Victoria 1990 and 1991: Summary report". Report No. 39, Monash University Accident Research Centre.
ELLIOTT, B (1993), "Road safety mass media campaigns: A meta analysis". Report No. CR 118, Federal Office of Road Safety. Elliott and Shanahan Research, Sydney.
ELLIOTT, B (in preparation), "Guidelines for effective road safety campaigns". Report to Federal Office of Road Safety. Elliott and Shanahan Research, Sydney.
HAKIM, S, SHEFER, D, HAKKERT, AS, and HOCHERMAN, I (1991), "A critical review of macro models for road accidents". Accident Analysis and Prevention, Vol. 23, No. 5.
HARRISON, WA (1990), "Update of alcohol times as a surrogate measure of alcohol-involvement in accidents". Research Note, Monash University Accident Research Centre.
PASCOE, M (1988), "Road safety and the economy". Bureau of Transport and Communications Economics, Reference Paper No. 133
THORESEN, T, FRY, T, HEIMAN, L and CAMERON, MH (1992), "Linking economic activity, road safety countermeasures and other factors with the Victorian road toll". Report No. 29, Monash University Accident Research Centre.
APPENDIX A
EVALUATION OF SPEED CAMERA PROGRAM
PHASE 2: EFFECTS OF PROGRAM MECHANISMS
MODEL FITTED TO MONTHLY LOW ALCOHOL HOUR CASUALTY CRASHES
| CASUALTY CRASHES = a | x (e^TREND)^b (1 in Jan 1983, 2
in Feb 1983, .. ) x URATE^c (unemployment rate during month) x TINS^d (speed camera TINs issued) x HOURS^e (hours of camera operations) x TARPS^f (TAC road safety publicity TARPs) x FEB^g (dummy for February months) : : x DEC^q (dummy for December months) |
APPENDIX B
MODEL FITTED TO MONTHLY HIGH ALCOHOL HOUR CASUALTY CRASHES
| CASUALTY CRASHES = a | x (e^TREND)^b (1 in Jan 1983, 2
in Feb 1983, .. ) x URATE^c (unemployment rate during month) x RBTT^d (RBT tests) x ALCS^e (alcohol sales) x ADSTOCK^f (TAC publicity Adstock) x FEB^g (dummy for February months) : : x DEC^q (dummy for December months) |