Enzymes
Enzymes are biological catalysts, increasing the rate of a reaction in a living organism without themselves being changed in the reaction. Each enzyme has a unique shape, including a pocket in its structure called an active site. The active site binds to a molecule that undergoes a reaction, named a substrate. It is the unique complex shape of each active site that allows it to interact with other molecules and catalyse the reactions in the body.
Use this page to revise the following concepts within enzymes:
Lock-and-key model
The lock-and-key model below is used to illustrate how an enzyme catalyses a reaction. The enzyme’s active site specifically fits the reacting molecule, known as substrate. The substrate attaches to this active site and the covalent bonds within the substrate are weakened. The activation energy for the reaction is lowered, enabling the catalytic reaction to happen. Once the reaction is complete, the active site of the enzyme becomes vacant for another reaction.

An energy profile diagram , such as the one below, shows how a catalyst provides an alternative pathway for a reaction that has a lower activation energy.

An example of an enzyme is sucrase (Note: many enzymes have names that end in -ase). Sucrase acts as a catalyst for the hydrolysis of sucrose (table sugar) to glucose and fructose.

The mechanism of sucrase is described below:
- Sucrase is represented by the purple shape in the diagram below.
- Sucrose molecules (the green substrate) fit the active site and form bonds to sucrase.
- The glycosidic bond in sucrose joining the glucose and fructose breaks.
- The fructose and glucose leave the site and sucrase can repeat its action with another sucrose molecule.

 Check your understanding
View
Check your understanding
View

Optimal conditions of enzymes
Enzymes have evolved to operate in living things and are highly sensitive to both temperature and pH. Each enzyme has an optimum operating temperature and pH. Their effectiveness is the highest if the organism operates near optimal conditions but the effectiveness drops as conditions deviate further from the optimum. This occurs because the bonds leading to the shape of enzyme active sites can be disrupted by changes in conditions, preventing the enzyme from binding effectively to the substrate and catalysing the reaction.
Temperature
In humans, enzymes have an optimal operating temperature, often around 37 °C to match that of blood. The graph below shows:
- At a lower temperature, the enzyme effectiveness is low. Many of the particles do not have sufficient energy to react.
- As temperature increases to the optimal temperature, the reaction rate increases as the particles collide more frequently and more vigorously.
- As the temperatures rise above the optimal, the tertiary and secondary structures break down. The primary structure is left intact. The change of secondary and tertiary structures disrupts the 3D shape of enzymes permanently. This is a process known as denaturation. Denaturation prevents enzymes from forming a complementary fit with the substrates, making them unable to catalyse the reaction.

pH
Enzymes operate effectively over a narrow pH range. The graph below shows the activity of amylase on the hydrolysis of starch, with its highest activity of hydrolysing starch at a pH of 8. This aligns with the typical pH of saliva, where this amylase is found. In highly acidic or alkaline solutions, the enzyme is denatured and ineffective. The optimum pH of each enzyme varies with where in the body it operates.

As with temperature changes, pH changes mainly affect the tertiary structure of the enzyme, in particular the ionic bonds between R groups. The presence of additional H+ or OH- ions will disrupt the hydrogen bonds, ionic bonds and dipole-dipole interactions , causing the enzyme to change shape, or denature. For example, examine the ionic bonds formed between the amino and carboxyl groups of -R groups of some amino acids. They can exist only when there is a neutral pH.
| Lower pH | Neutral pH | Higher pH |
|---|---|---|
 |  | 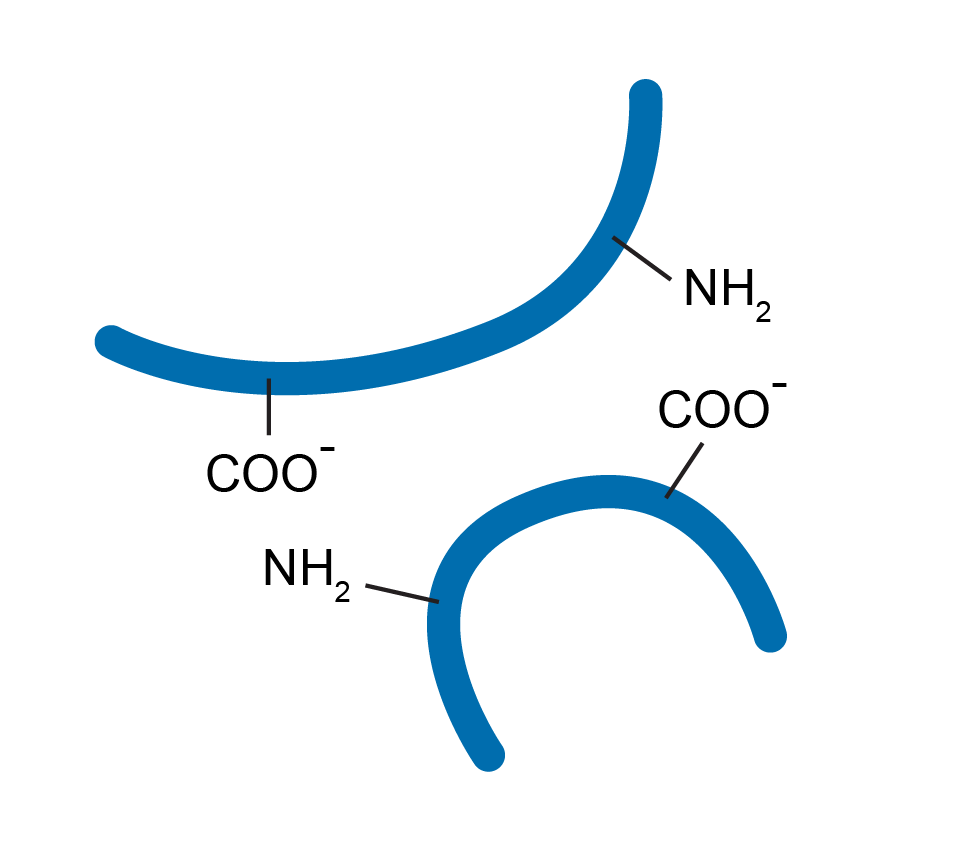 |
| Ionic bonding is disrupted, causing the polypeptide chain to unfold. The protein is denatured. | The ionic bonding between amino acid side chains allows the proper folding of the polypeptide to form the tertiary structure of the protein. | Ionic bonding is disrupted, causing the polypeptide chain to unfold. The protein is denatured. |
Competitive enzyme inhibitors
When a person is sick, sometimes their body produces unwanted substances that exacerbate the symptoms of the disease. When this is the case, medical scientists try to develop drugs that inhibit the formation of these toxins. A drug that works to block the active site of an enzyme is acting as a competitive enzyme inhibitor.
An example of a competitive enzyme inhibition involves the medicine methotrexate. Folic acid is an important nutrient that can be converted to other chemicals that are critical for cell growth and division in the body. This conversion is catalysed by the enzyme dihydrofolate reductase (DHFR). However, for a person with cancer, DHFR promotes rapid cancer cell growth and becomes problematic. The diagram below illustrates how the folic acid (shown in green) fits the active site of DHFR. To prevent the catalytic function of DHFR, methotrexate, an organic molecule designed to block the active site of DHFR, is introduced. Methotrexate binds to the active site of DHFR, preventing the substrate, folic acid, from binding. Some of the enzymes may still catalyse folic acid conversion, but many will be blocked by the methotrexate. This limits the conversion of folic acid to a growth-promoting agent.
