Extraction and identification
Plants produce complex, unique molecules that would be challenging and costly to synthesise. Many of these molecules have medicinal properties, or their structures are easily modified to make a pharmaceutical.
Use this page to revise the following concepts within add page title here:
Medicinal compounds from plants
Many plants contain compounds that have current or potential medicinal uses. Investigate the examples below.
Consider the tea-tree leaf shown. Among the large number of compounds found in each leaf, it is likely to contain over fifty potential active ingredients.

The table shown uses tea-tree oil to illustrate the complex nature of plant extracts.
| Component | Composition (%) |
|---|---|
| Terpinen-4-ol | 41.1 |
| γ-Terpinene | 21.0 |
| α-Terpinene | 11.4 |
| 1,8-Cineole | 4.7 |
| Terpinolene | 2.4 |
| ρ-Cymene | 2.6 |
| α-Pinene | 1.9 |
| α-Terpineol | 3.1 |
| Aromadendrene | 1.7 |
| δ-Cadinene | 1.0 |
| Limonene | 0.9 |
Plants are complex organisms containing thousands of different compounds. To study each of the active components in the tea-tree leaf above:
- the components in the leaf need to extracted from the leaf
- each component needs to be separated so that you can study its interaction in the body
- the structure of the components need to be determined.
The picture below shows the extraction, purification and identification process from a plant sample. After the solvent extraction, the concentrated extract is separated into three active compounds using chromatography. The structure of each compound can be identified using instrumentation, including mass spectrometry, NMR spectroscopy and IR spectroscopy.

Adapted from Yadav et al, 2021; Source (Step One): ResearchGate
Extraction
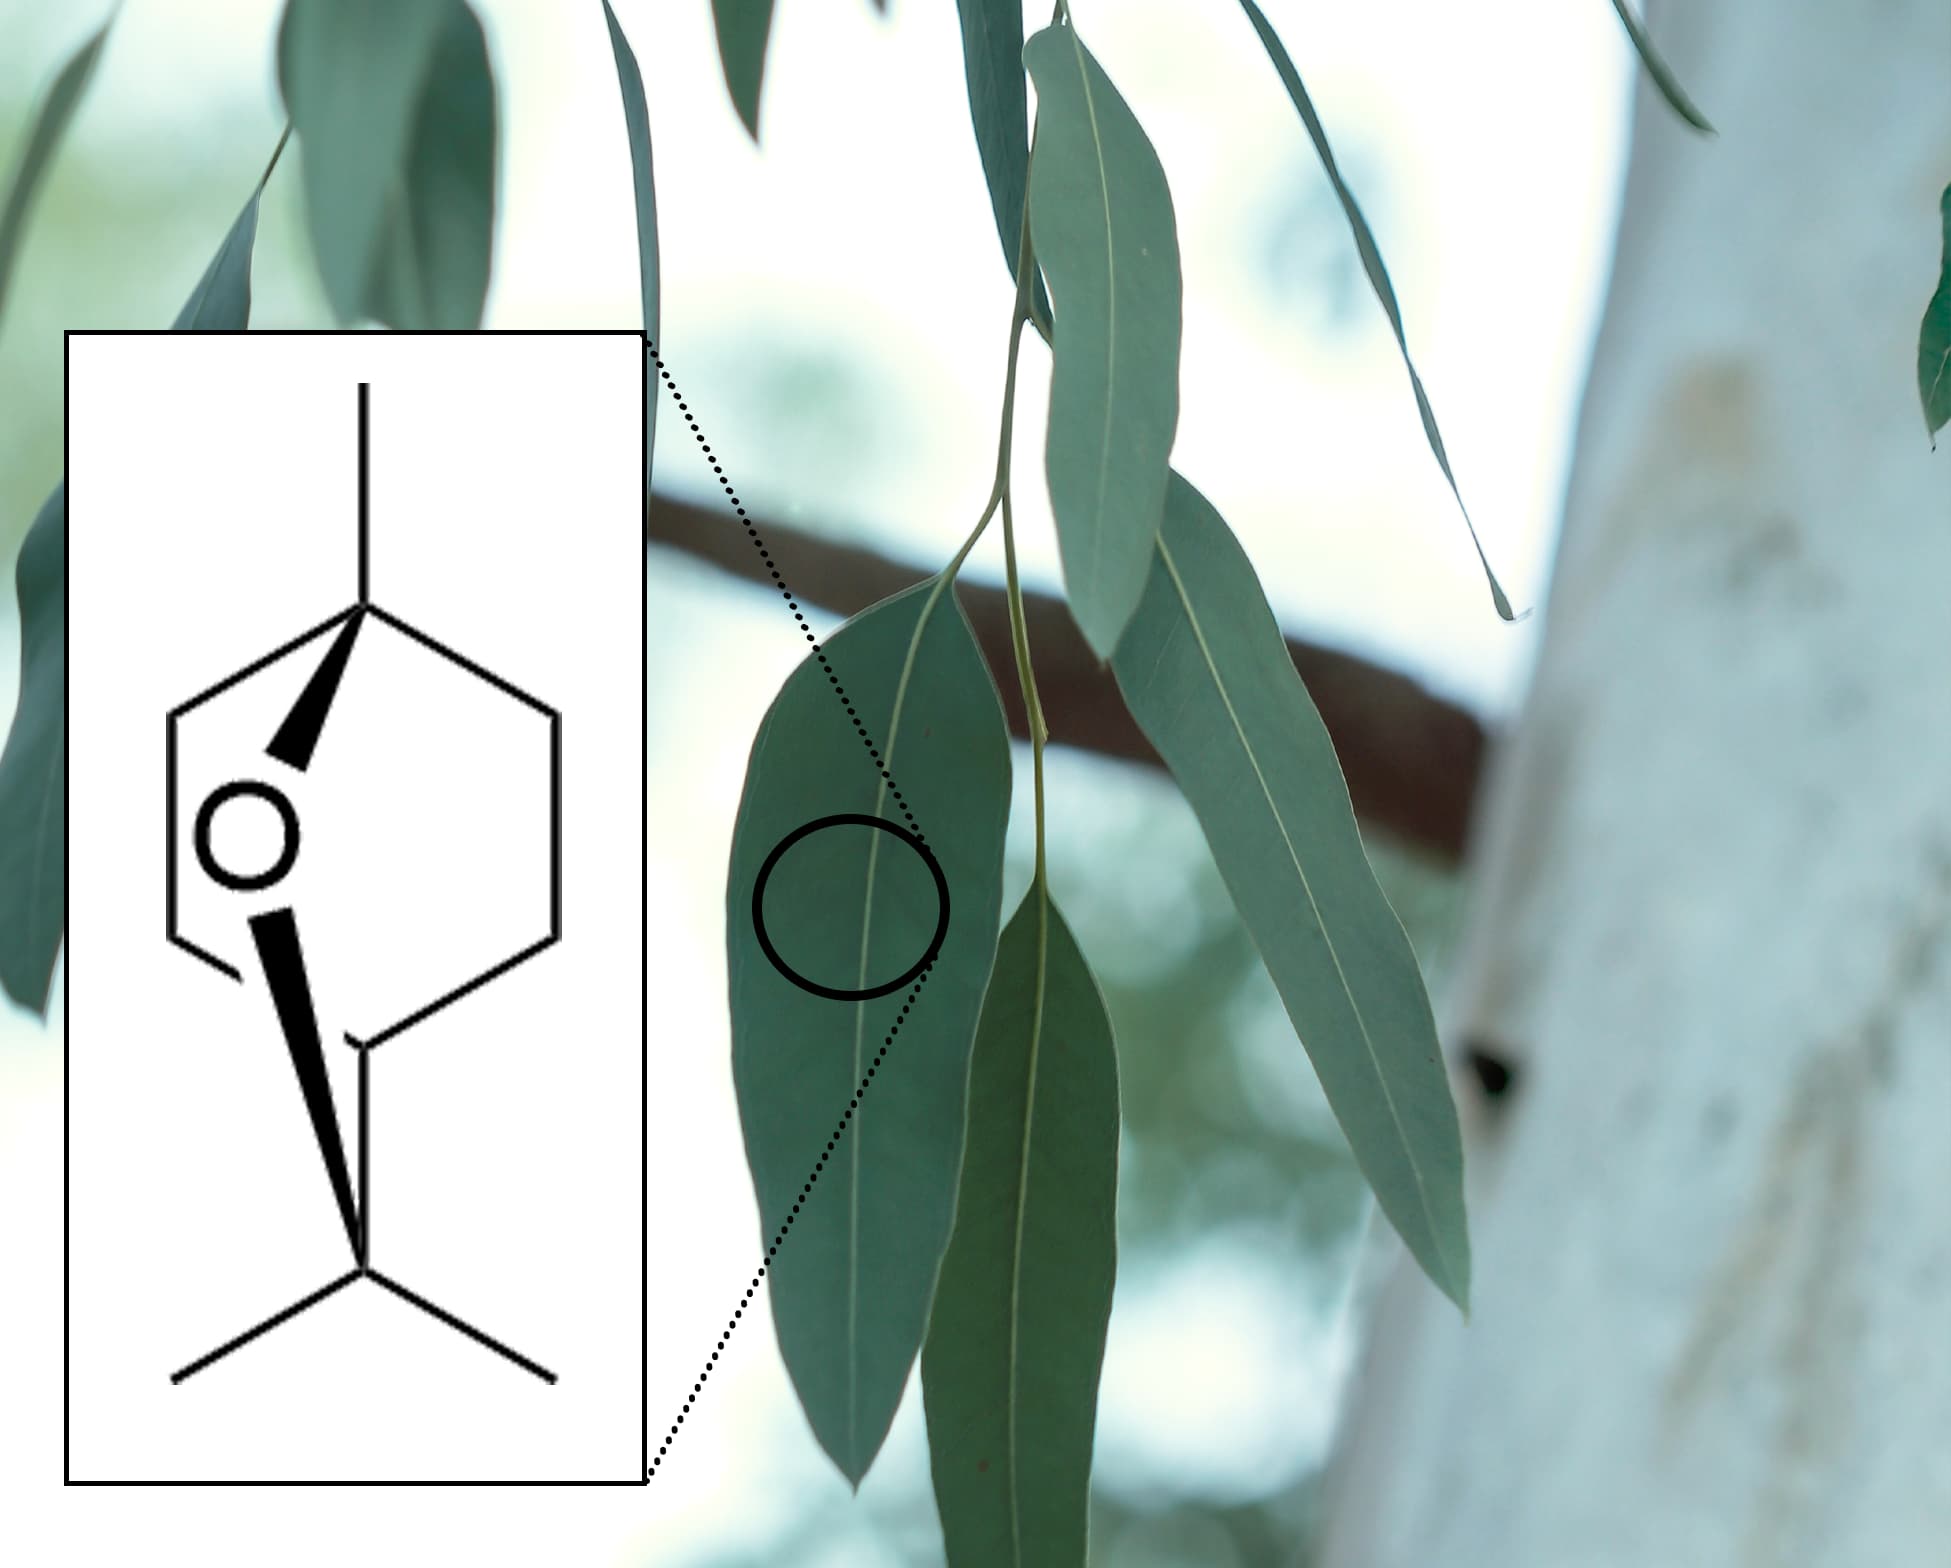
Many different extraction methods can be used to release or isolate the active components. For example, First Nations peoples in Australia use the heat of a fire to release active ingredients in the Eucalyptus leaves into the surrounding air.
In modern laboratory and industrial process, solvent extraction, steam distillation and chromatography are often used to obtain active components.
Solvent extraction is the removal of a substance from a mixture by dissolving it in a solvent. Leaves are very tough and many of the components are insoluble in water. Scientists use a range of techniques to improve the efficiency of extraction. These include:
- shredding or blending the leaves to break down their cell structure and to increase the surface area
- using heat to improve the solubility of the desired components in the solvent, if the active compound is stable under heat
- choosing a solvent that has a polarity similar to that of the components of interest
When choosing a solvent, the solubility rule ‘like dissolves like’ is used. A polar solvent, often water, is used to extract polar components while a non-polar solvent is used to extract non-polar components like oils. The diagram below provides a visual of one form of solvent extraction. Most plant extracts are green in colour due to the chlorophyll content, however, they contain many other components.

Steam distillation is a method used to extract compounds from plants. It is suited to thermally stable and volatile non-polar components, such as plant oils. In this process, a flow of hot steam is passed through plant leaves. The steam breaks down the cell structure and carries an extract through to a condenser. The condenser cools the steam and extract, and the non-polar components form a separate layer to the condensed water, which can be collected.
The diagrams below show how steam distillation works and a laboratory example of it in practice to make products such as eucalyptus and lavender oil.

Source: Adapted from Machado, C. A., Oliveira, F. O., de Andrade, M. A., Hodel, K. V. S., Lepikson, H., & Machado, B. A. S. (2022). Steam distillation for essential oil extraction: An evaluation of technological advances based on an analysis of patent documents. Sustainability, 14(7119). https://doi.org/10.3390/su14127119
High-Performance Liquid Chromatography (HPLC) is a powerful technique used to purify active components from plant extracts. The plant extract is injected into the HPLC system, where it passes through a column containing a stationary phase. As the components interact differently with the stationary phase, they are separated and collected based on their retention times, isolating the desired active compounds with high precision.
Aspirin is manufactured from a component of the bark of the willow tree. A willow tree bark extract mixture is passed through a HPLC column. An example of a chromatogram obtained is shown below.
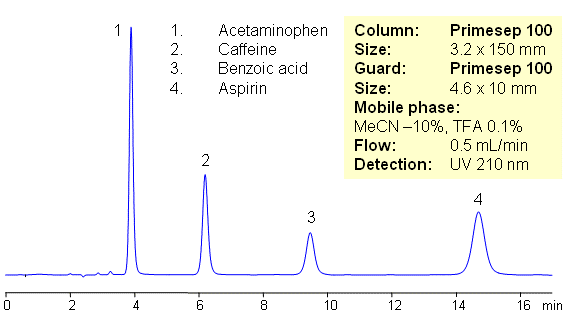
The chromatogram shows that the mixture contained at least four components. The different structures of each component leads to each substance taking a different amount of time to pass through the column. Samples that elute at different retention times can be collected separately and chromatography can be used as a purification method.
After comparing the retention time of peak 4 with that of a pure aspirin sample under the same chromatography conditions, peak 4 matches the retention time of the standard sample and is identified as aspirin. The solvent in the collected peak 4 sample is removed, yielding a pure substance. Its structure can be analysed later using other instrumental analysis methods.
The aspirin concentration can be determined by comparing the area under peak 4 with the area under the curve of other standard solutions of aspirin.
Identification
After extraction and purification, chemical instruments are used to identify compounds extracted from plants by determining their structure. Most compounds have complex structures containing multiple functional groups so the analysis is often complex. The instruments commonly used are mass spectrometer, infrared spectroscopy (IR), and nuclear magnetic resonance spectroscopy (NMR). The tabs below to detail how the structure of aspirin can be determined and confirmed using analytical instruments.
When injecting a purified aspirin sample collected from HPLC, the highest peak on the generated mass spectrum has a m/z ratio of 180, matching a relative molecular mass of 180 and a molecular formula of C9H8O4.
The other significant peaks are caused by fragments of the aspirin molecule.
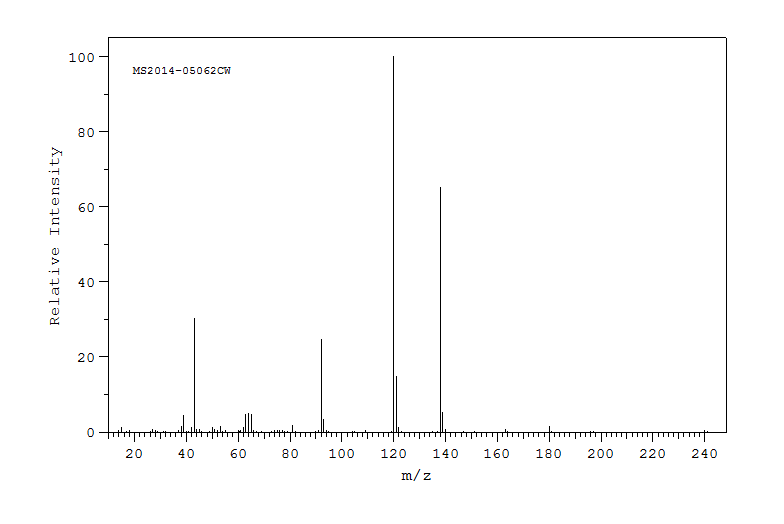
Source: AIST: SDBS, 2015
Infrared spectroscopy provides information about chemical bonds through the detection of how infrared light is absorbed by the sample. It gives information about functional groups. The IR spectrum of aspirin below suggests the existence of a carboxyl group from O-H (acid) at 2500-3500 cm-1 and a carbonyl bond C=O (acid) at 1680-1740 cm-1.
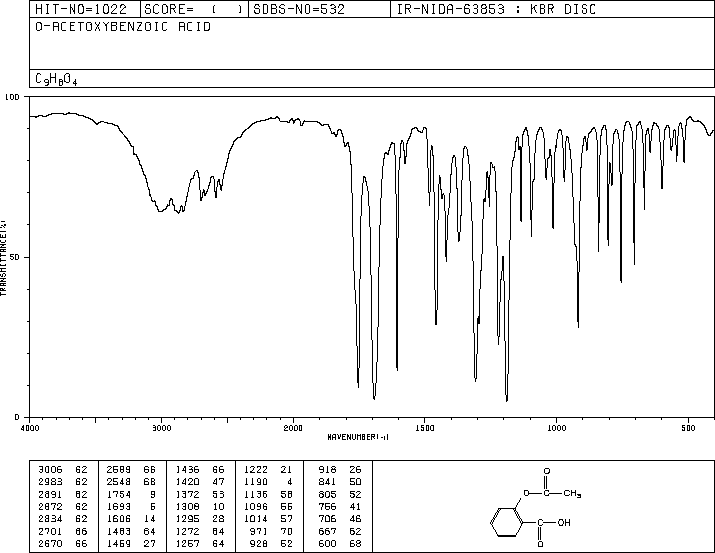
Source: AIST: SDBS, retrieved Dec 2024
Carbon NMR
Carbon NMR uses radio waves in a strong magnetic field to detect the chemical environment of each carbon atom in an organic molecule. Carbon-13 atoms first absorb, and then emit, energy from the radio waves. This emitted energy is measured as a shift value. The chemical environment around each carbon atom leads each carbon to have a different chemical shift value, as illustrated by the peaks in the 13C NMR figure. The shift values can be checked against measurements of known molecules to identify the possible connections around the carbon atoms. On the spectrum below, each carbon atom has been numbered so you can match it to the peak it caused. The spectrum shows there are 9 different carbon environments.
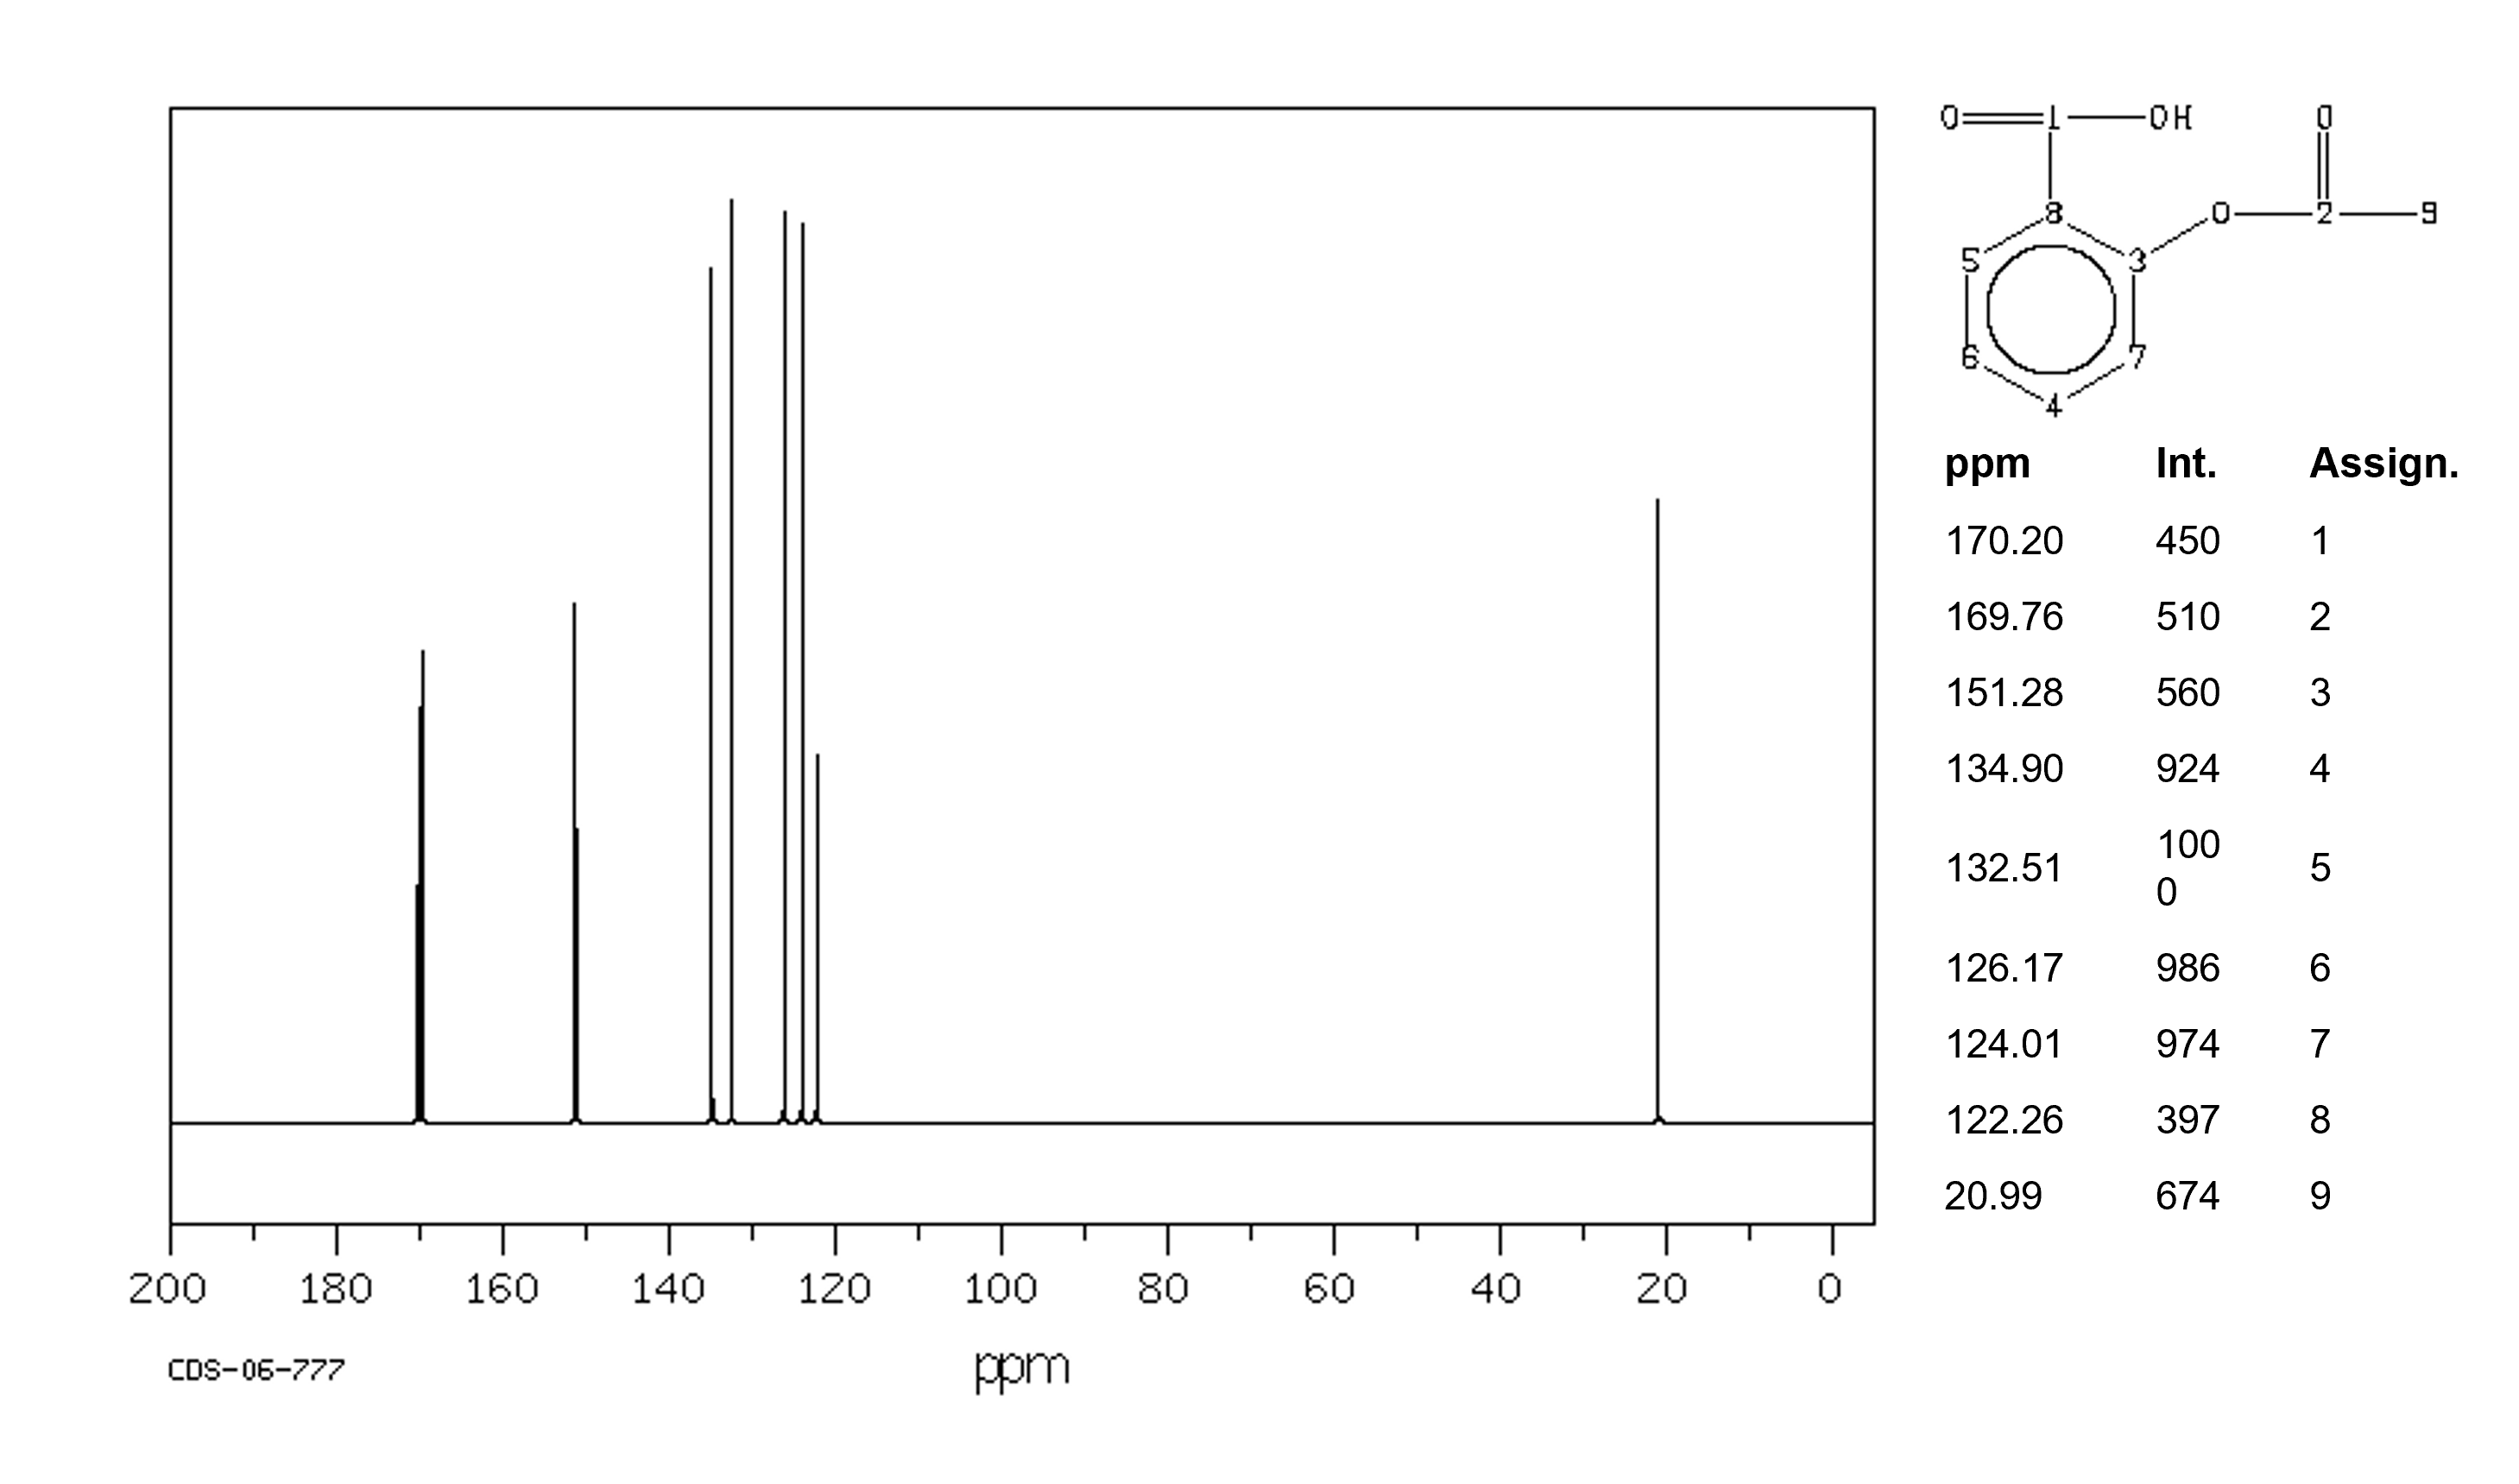
Source: AIST: SDBS, 1999
Proton NMR (1H NMR)
Similar to carbon NMR, proton NMR uses radio waves in a strong magnetic field to detect hydrogen-1 atoms in a molecular structure. Each hydrogen atom on the aspirin structure has a letter of the alphabet beside it so you can see which peak corresponds to. Again, these peaks are interpreted by comparison to the functional groups of known molecules.
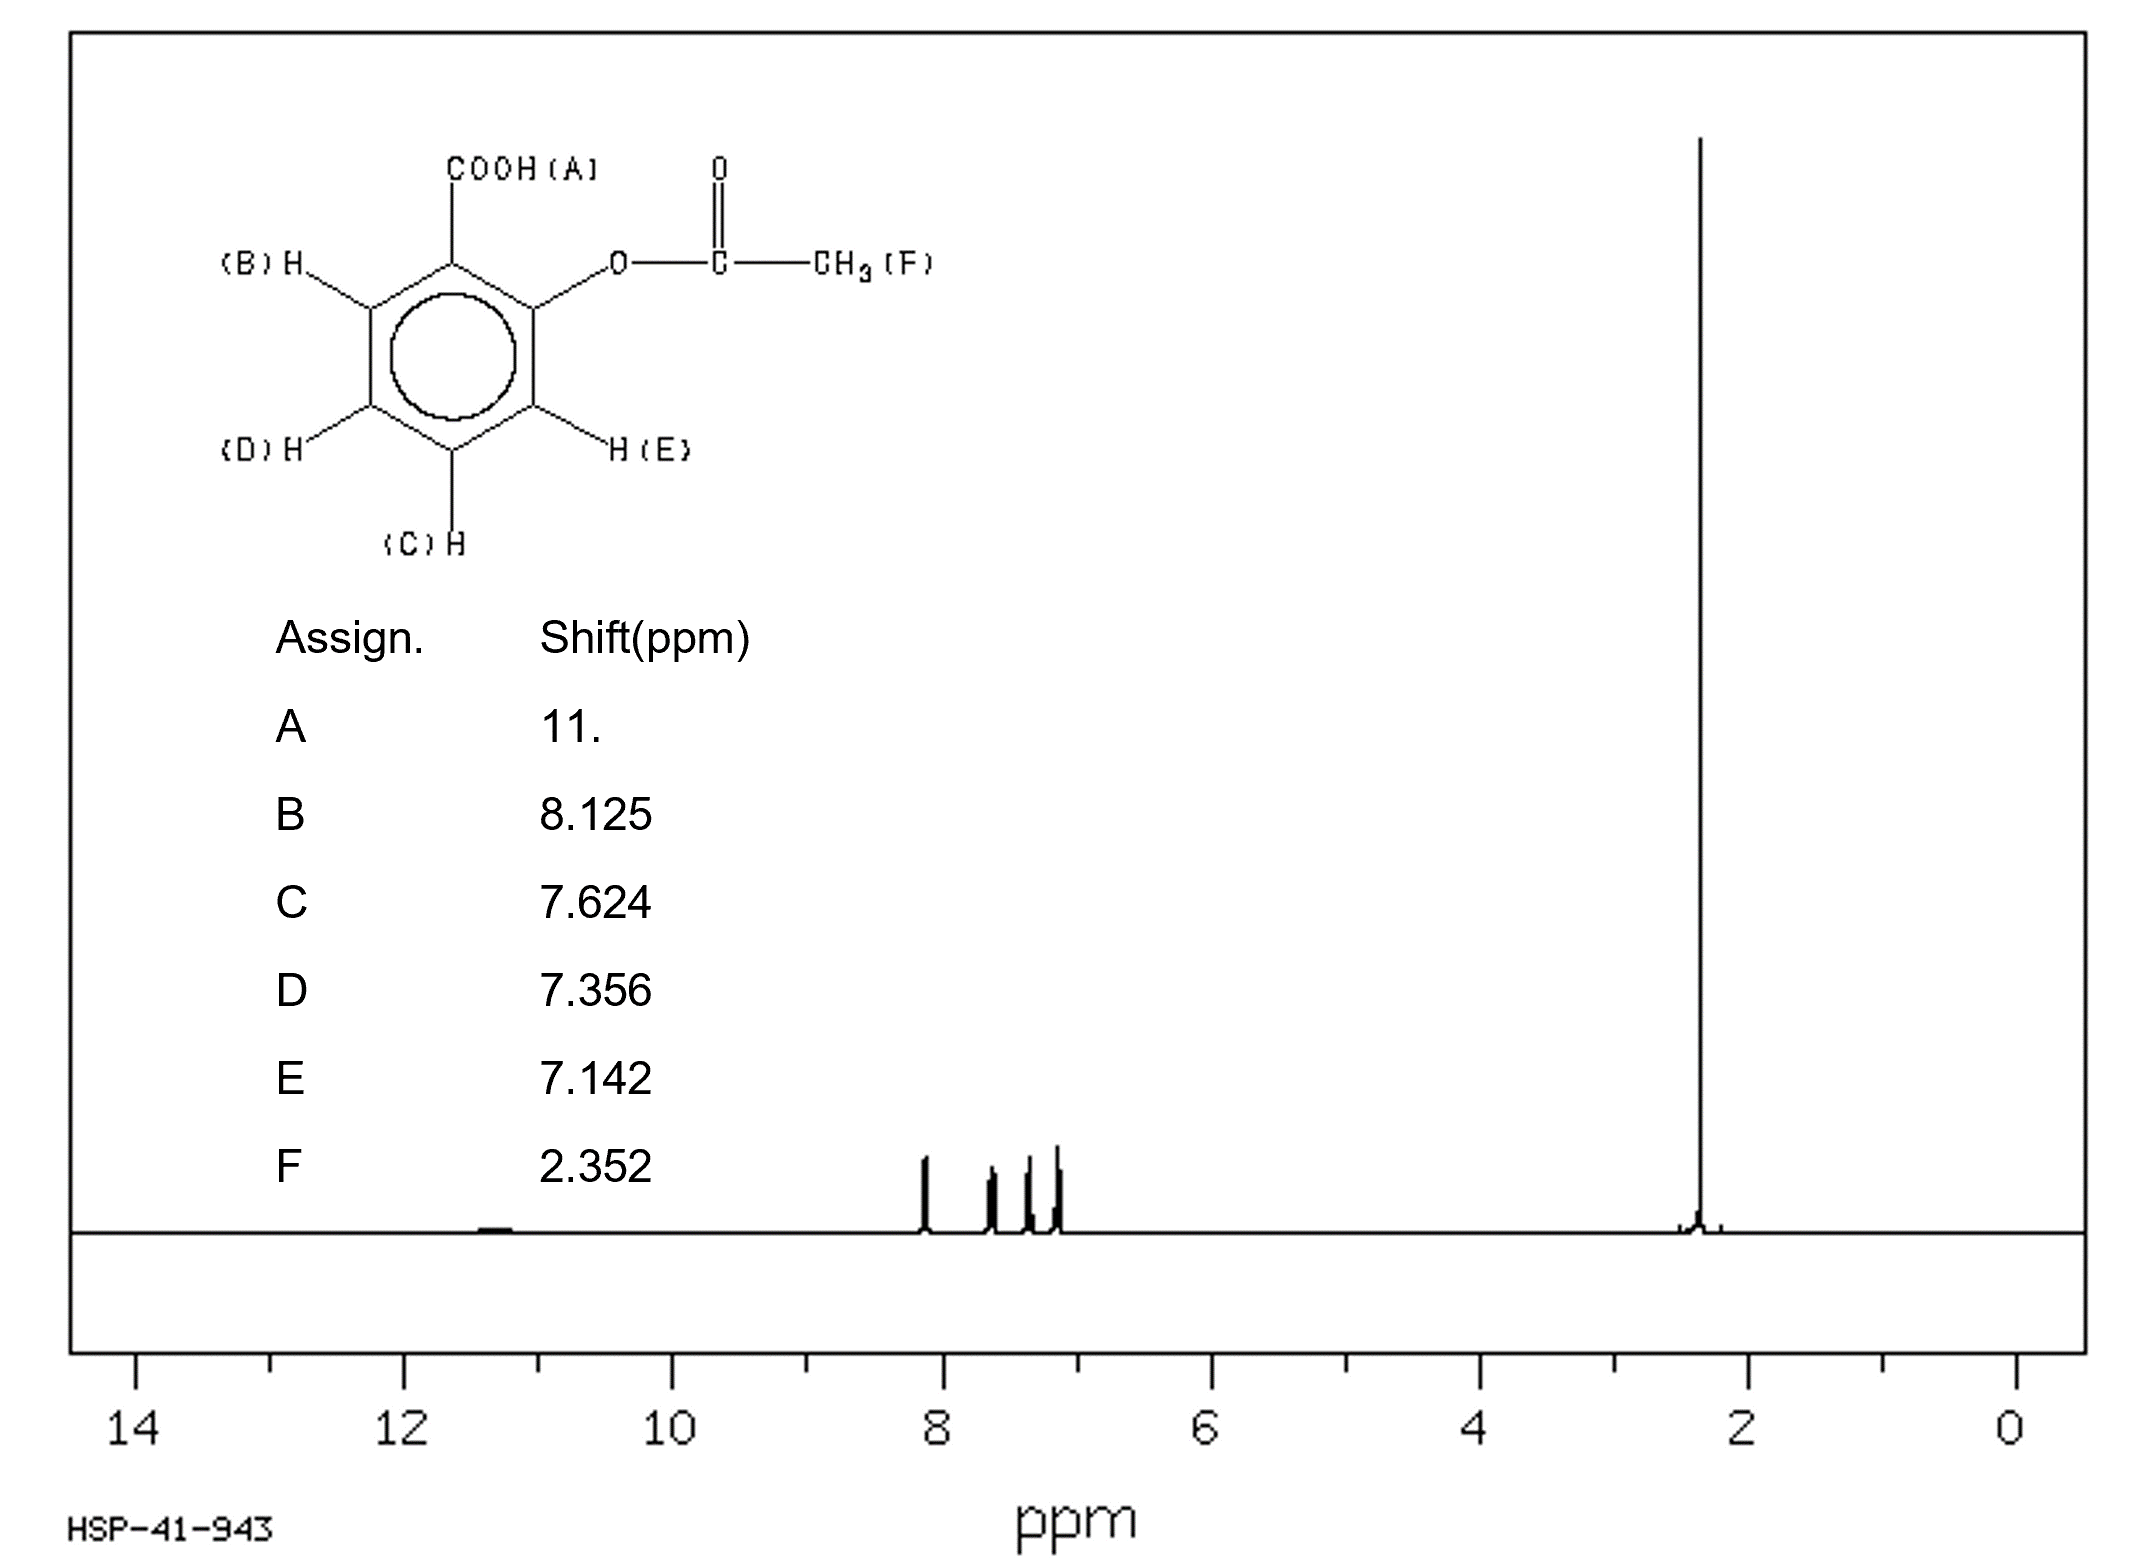
Source: AIST: SDBS, 1999
