
Beyond the bar chart: Creative data storytelling for modern classrooms, research and corporate training
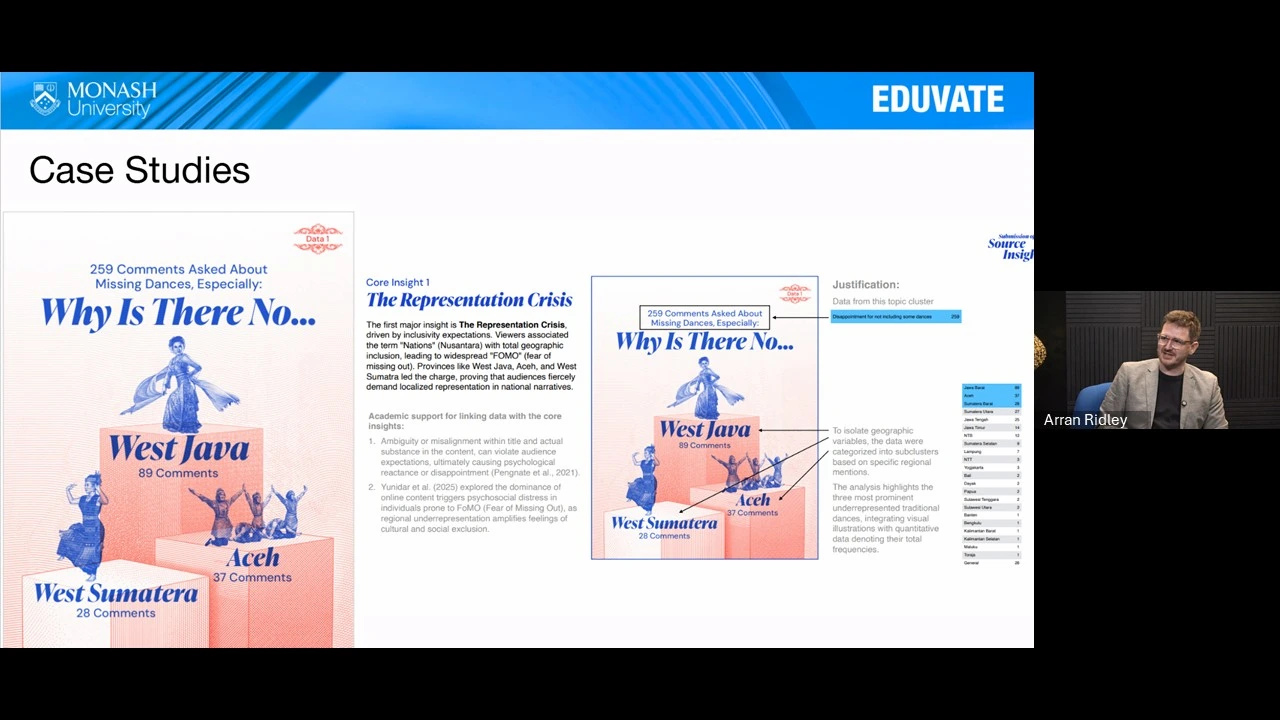 Dr. Arran Ridley delivering the webinar on data storytelling
BSD City, Tangerang – Data communication requires more than standard visual charts. On Wednesday 19 August 2026, Monash University, Indonesia hosted a live 90-minute webinar titled 'Beyond the bar chart: Creative data storytelling for modern classrooms, research and corporate training'. Led by Dr. Arran Ridley, the online session showed how human-centred narratives transform raw numbers into clear, actionable insights across academic and professional settings.
Transforming data communication across sectors
Modern organisations generate vast volumes of data daily. However, presenting raw metrics without context often leads to cognitive overload. Audiences struggle to extract meaningful conclusions from dense spreadsheets or static slide decks.
Creative data storytelling bridges the gap between raw analysis and human understanding. By combining structured data, thoughtful visual design and clear narrative arcs, presenters can improve comprehension, information retention and decision-making.
This webinar brought together higher education professionals, academic researchers and corporate trainers. Participants explored practical ways to turn numbers into compelling stories that engage readers and drive action.
Bridging data cleaning and narrative structure
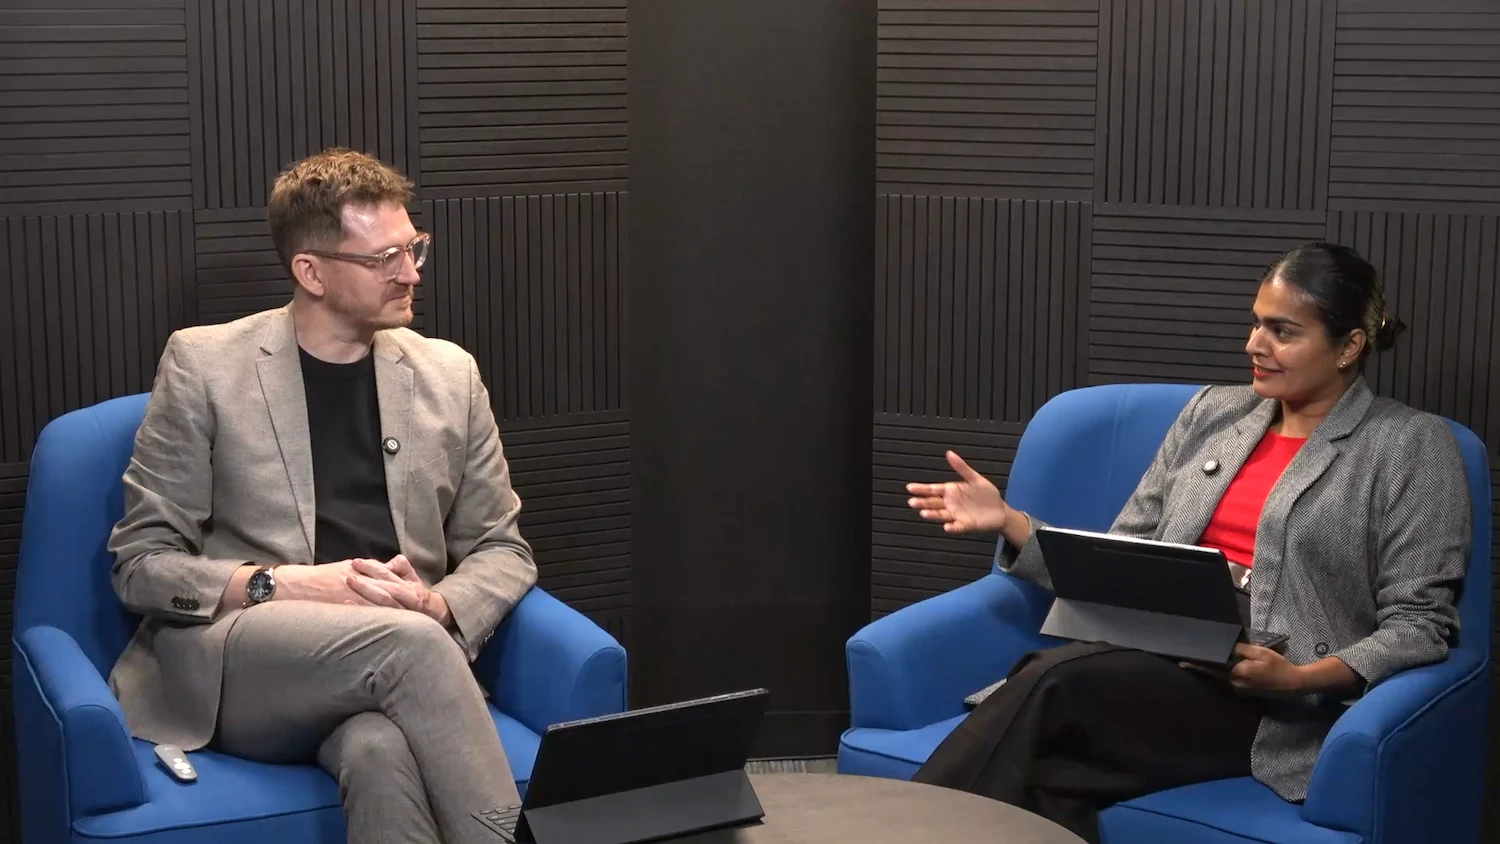 Dr. Arran Ridley (left) and Dr. Gabriela Fernando (right) having a Q&A
Data analysis begins with data cleaning. Analysts spend substantial time removing errors, handling missing values and structuring datasets. While data cleaning ensures technical accuracy, it does not explain what the numbers mean to an audience. Communicators must connect data preparation directly to narrative design. Narrative structure gives factual data real-world meaning.
Steps to turn clean data into a clear story
- Define the core objective: Identify the main insight or decision your audience needs to make before creating visuals.
- Filter out non-essential metrics: Remove clutter and secondary data points that distract from the main message.
- Establish a clear narrative arc: Arrange findings into a logical sequence containing a context, a core challenge and a recommended outcome.
- Focus on human impact: Frame statistical changes around how they affect people, operations or research outcomes.
The role of generative AI in visual and text drafting
The webinar featured a provocative discussion on how generative artificial intelligence affects content production. AI tools are reshaping how professionals design visuals and draft analytical text.
Generative AI applications can process tabular datasets quickly. They can suggest appropriate chart types, draft initial summary paragraphs and propose visual layout ideas within seconds. This capability accelerates the early stages of data communication and reduces production time.
Responsible AI integration in data workflows
- Outline story concepts: Use AI to generate initial narrative outlines from cleaned datasets.
- Prototype design ideas: Experiment with visual layout variations quickly before finalizing presentations.
- Maintain human oversight: Review all AI-generated outputs carefully to ensure factual accuracy and ethical reporting.
- Preserve contextual nuance: Refine automated text to match institutional tone, brand standards and audience requirements.
While generative AI offers clear speed advantages, it cannot replace critical thinking. Presenters must maintain human editorial control to ensure accuracy, ethical integrity and clear context.
Practical applications across education, research and industry
Audience-centred data storytelling applies across multiple professional environments. Adapting communication choices to reader needs ensures information moves smoothly from presentation slides to real-world application.
Enhancing classroom learning
Educators can replace static textbook figures with interactive data visualisations. Presenting numerical concepts through stories helps students grasp complex statistical relationships faster. It also encourages students to analyze data visualisations critically.
Expanding research impact
Academic researchers must present findings to grant committees, industry partners and public stakeholders. Translating complex journal datasets into clear visual narratives helps research reach beyond academic circles. This approach demonstrates tangible societal and economic benefits clearly.
Driving corporate decisions
Corporate trainers and business leaders frequently present performance metrics to executive teams. Using narrative frameworks allows presenters to highlight key trends, evaluate operational risks and secure strategic buy-in efficiently.
Road to Eduvate 2027 and cross-campus collaboration
This webinar represents a key milestone in the Road to EduVate 2027 event series. As higher education and industry sectors evolve, Monash University, Indonesia continues to lead discussions on innovative teaching, research communication and digital strategy.
Eduvate 2027 brings together educators, students and sector partners to address shared challenges and explore new learning frameworks. By combining the strengths of Monash University, Indonesia and Monash University, Malaysia, the initiative fosters international collaboration and regional educational impact.
Future events in the Road to Eduvate 2027 series will continue to explore practical tools, research applications and collaborative opportunities for academic and professional communities.