Data walking & crafting: A new approach to understanding data in the urban environment
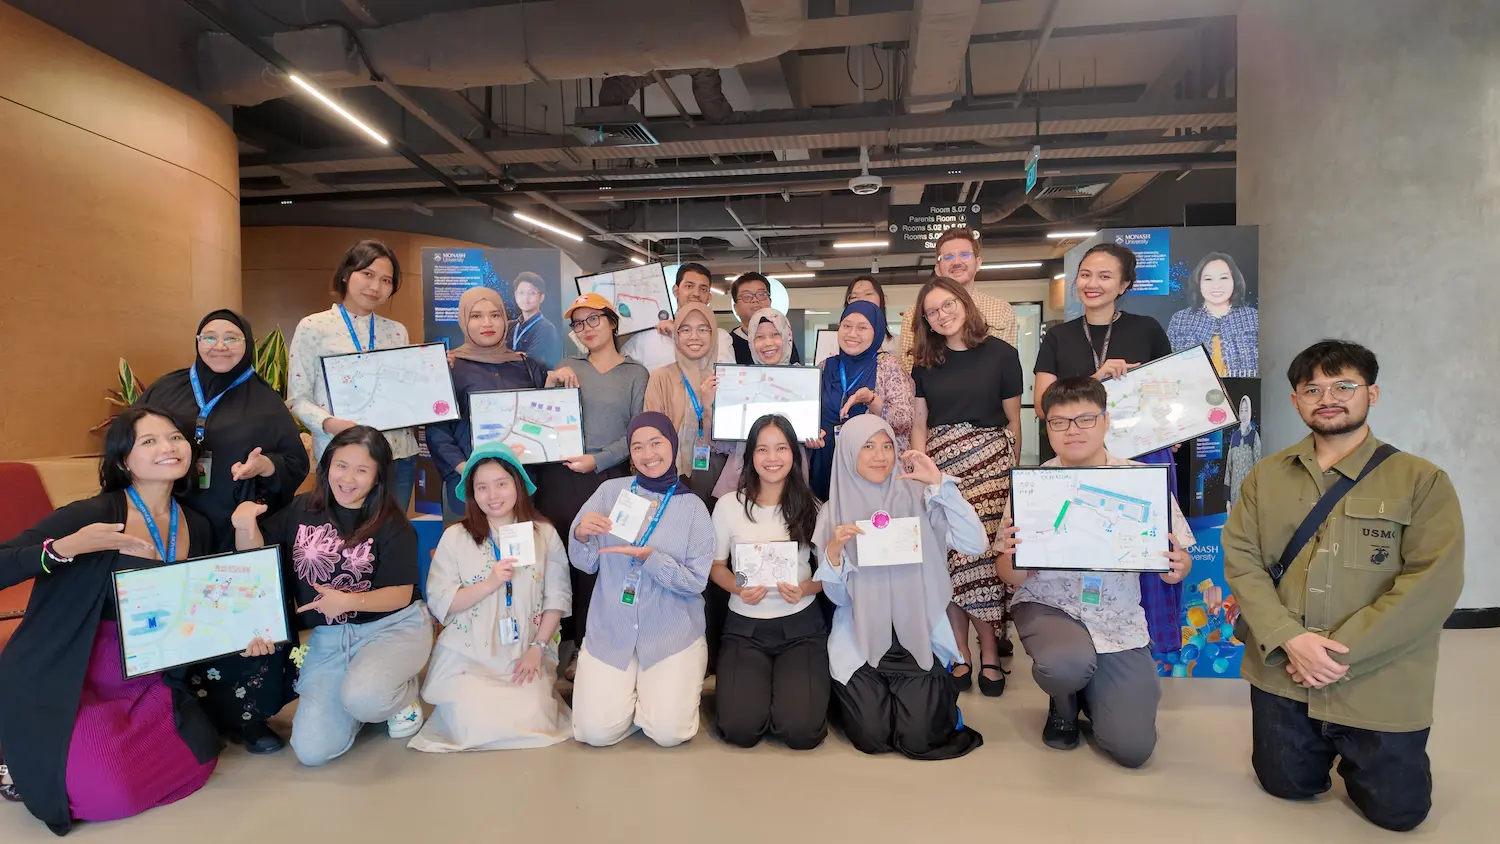
Students and academics take a group photo after the workshop
BSD City, Tangerang – On 30 April 2026, Master's students from across Monash University Indonesia's master's programs — including Data Science, Public Health, Marketing and Digital Communications, and Urban Design stepped away from their screens and out into The Breeze, for the Data Walking and Crafting workshop — a 2.5-hour, hands-on exploration of how data is collected, interpreted, and communicated through embodied experience.
The workshop, led by Dr. Arran Ridley, Assistant Professor and Program Coordinator for the Master of Marketing and Digital Communications and Joanne Amarisa, founder of Data Garden Co., asked a deceptively simple question: can walking and hand-crafting produce a more critical and humanistic understanding of data than conventional, screen-based methods alone?
From spreadsheets to footpaths
Data literacy in communications education tends toward the quantitative — dashboards, analytics tools, structured datasets with clean variables and clear outputs. The Data Walking and Crafting workshop proposed a different starting point: the body, the street, and the hand.
Built on the practice of psychogeography — a field of study concerned with how physical surroundings shape human emotion, behaviour, and movement — the workshop drew on the French concept of the dérive: walking attentively and without a fixed agenda, noticing the built and natural environment as it actually presents itself. Rather than treating data collection as a clinical exercise, the workshop approached it as an embodied, relational, and fundamentally human practice.
Students worked in small groups, each choosing one of two observation themes to investigate along a set trail through the BSD campus: Visual Communication, examining signage and its intended audiences, or Walkability, auditing barriers and ease of movement through the space. Each participant tracked one to two variables, and every group also tracked a Personal Variable — their own subjective experience of the environment — as a deliberate part of the dataset.
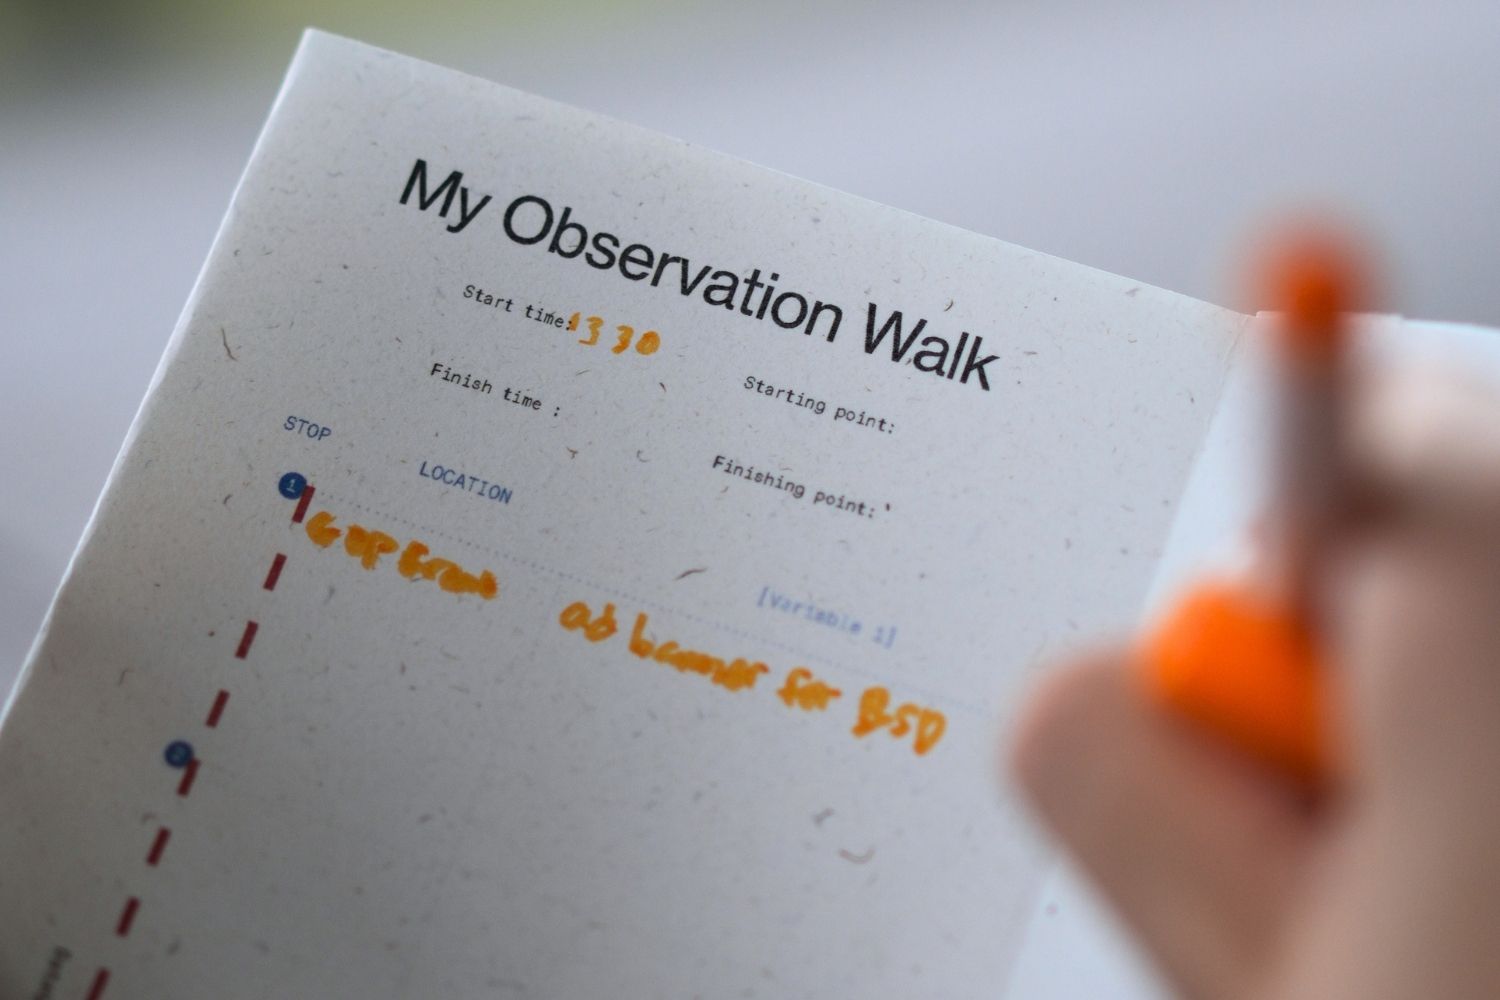
A student taking notes on a worksheet
Reading a familiar place differently
For many students, the BSD Sinarmas Land complex is simply the area around their university — somewhere to pass through on the way to The Breeze for lunch. The data walk changed that. Participants came back having noticed things they had walked past dozens of times without registering: lighting conditions, vegetation type, the texture of paths underfoot, where rain cover exists and where it abruptly stops.
The walkability groups documented their findings in granular detail. Paths were assessed for surface quality — including how navigable they were in everyday footwear. Tree trunks growing up through pavement and uncovered drains were logged as physical hazards. Groups mapped where rain protection was available across the route, noting the unevenness of coverage across different parts of the complex. One group developed a composite disability-friendliness rating for different areas, drawing on multiple qualitative observations to produce a star-based score — an intuitive move toward building an index from qualitative data. With Urban Design students among the participants, observations about accessibility, vegetation, and infrastructure carried an additional analytical sharpness.
Lighting was mapped across the route, with the distribution of well-lit and poorly-lit areas producing an implicit picture of how the space functions — and for whom — at different times of day.
The visual communication groups, meanwhile, developed a working typology of signage by both function and placement. Advertising signage — directed at potential customers — was found consistently at eye level, while identity signage such as building names tended to sit above eye level. The placement, the groups observed, follows the logic of its intended purpose: advertising needs to intercept attention, while identity signage orients rather than persuades. Groups also noted the languages used across different sign types, and the assumptions about audience that those choices encode.
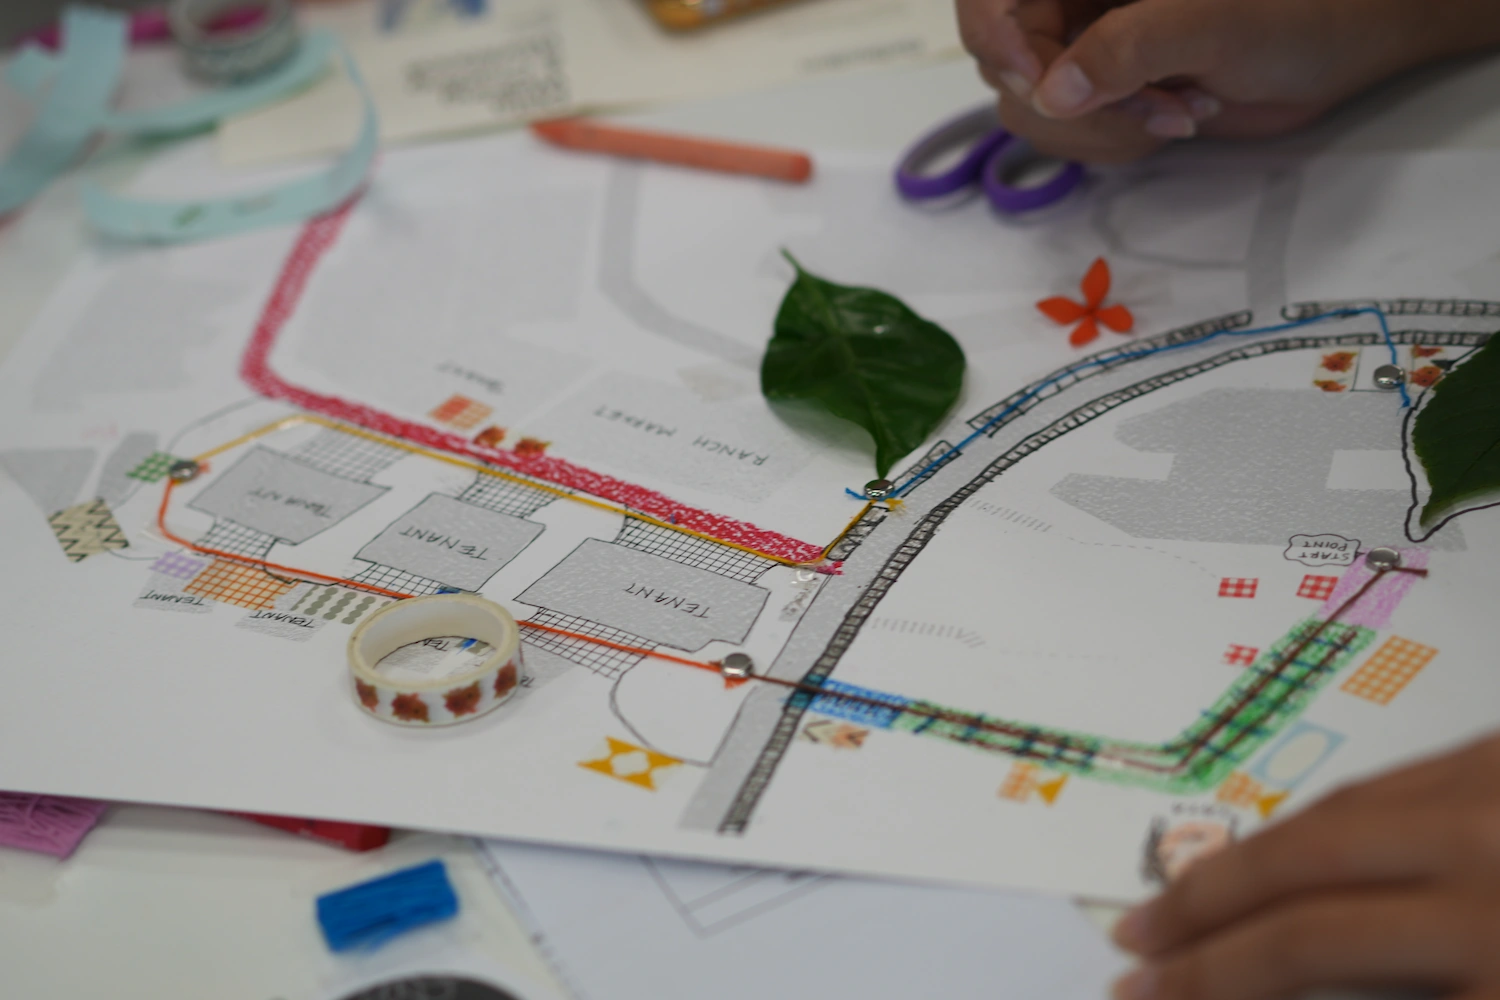
A student meticulously decorates a map of The Breeze tenant space
What counts as data?
Before the mapping activity began, students asked pointed questions: what counts as data here? How do you work with observations that resist easy categorisation? Many participants were more accustomed to working with quantitative data — structured, measurable, comparable. The ambiguity of qualitative observation was initially uncomfortable.
That discomfort turned out to be productive. Back in the classroom, students were first asked simply to map their walking route, and then to encode their variables in whatever visual form made sense to them — threads, markers, Washi tape, pencil, colour. What emerged was varied and imaginative. Each group developed its own visual language around their data, a shared encoding system that made sense internally and communicated their findings to others.
One participant described the experience as being like developing a secret code — the kind that might pass between a mother and child. The groups understood their own systems intuitively. One group took evident enjoyment from watching the facilitators struggle to interpret their encoding — a moment that said something real about how data visualisation works: encoding always implies an audience, and legibility is never automatic.
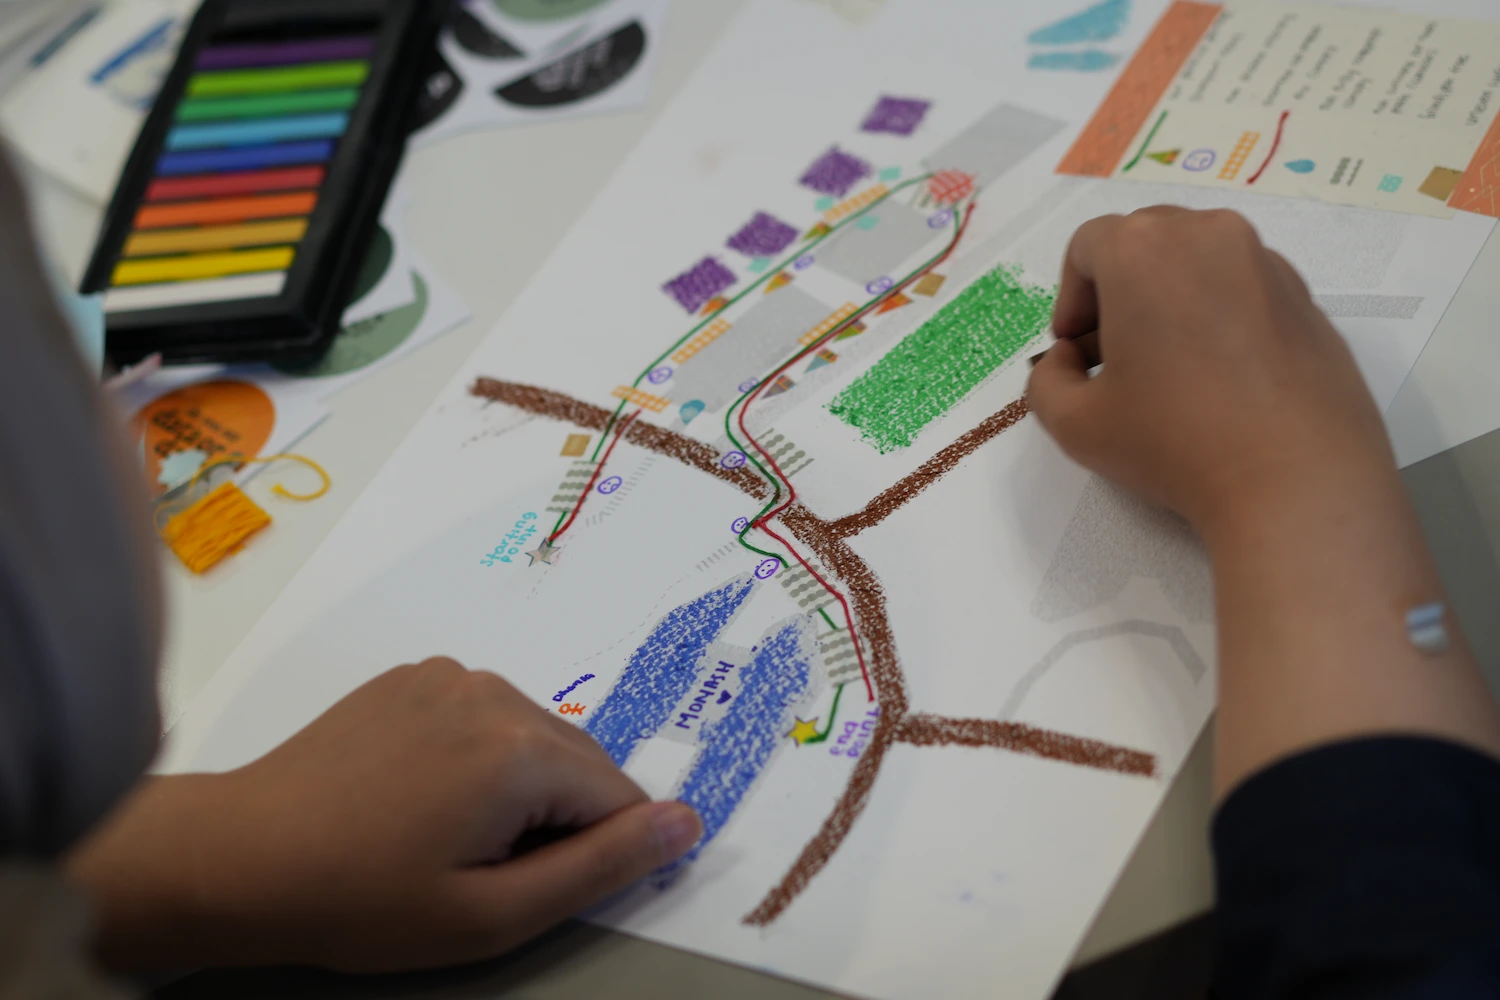
A student using colorful pastels to create a hand-drawn map
Seeing differently
Participants reflected that the workshop would change how they move through and observe their environment. Where before they might have passed through Monash campus and The Breeze without much active attention, they would now find themselves noticing — lighting, signage, surfaces, barriers, vegetation — in a way they had not previously.
That shift in perception is, in many ways, the point. Professionals who understand data only as something processed at a desk will miss the ways in which data is always already embedded in the physical world around them — in the placement of a sign, the width of a footpath, the species of tree lining a commercial boulevard. Across disciplines — whether public health, urban design, marketing, or data science — the ability to read an environment critically is a transferable and undervalued skill.
The workshop contributes to ongoing research on data crafting methodologies, with outcomes informing a follow-up research paper on the use of embodied, creative methods in data education. The findings from this campus walk — its signage logics, its walkability gaps, its uneven infrastructures — are, in that sense, just the beginning.