Faculty Grade Distribution Report
| Access to Board of Examiner reports is restricted to BOE Chair, Faculty Associate Dean Education, Head of Department/School and Faculty Professional Staff. |
|---|
The Faculty grade distribution report presents data for a specific teaching period, highlighting variations for faculty consideration and to support discussions at Board of Examiners (BOE). The grade distribution data is grouped by school/department level where applicable and can be drilled down to unit level.
Access report (authorised users only)
To request access, complete the following form: Request access to Power BI Results Management Reports.
The following instructions will guide you through all pages in this report.
Watch a demonstration of the key features of the Faculty Grade Distribution Report presented by Tamara Goldberg(23 mins) or view the text-based guide below. Click on the ^ arrow at the bottom of the video to view the table of contents and skip to topics of interest.
Home
The home page of the Faculty Grade Distribution report features the report title, description and contact point for feedback and enquiries. It is the first page that displays by default for this report. Also referenced on this page is the last report refresh date timestamp. The report is refreshed once daily. To navigate to different pages of the report, use the Pages panel on the left hand side of the report. The current page you are viewing is highlighted in the list of pages.
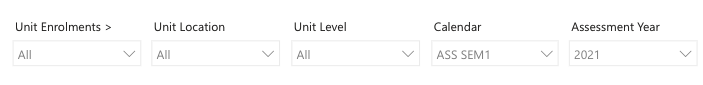
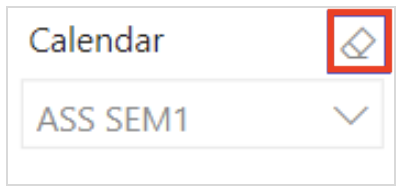
Faculty Grade Distribution report global filters
The Faculty Grade Distribution report features a set of filters that are visible at the top of the page and are applicable to all report pages. These filters persist as you navigate between report pages. If you close the report browser window and navigate back to the report in a new browser window, these filters will be set back to defaults (i.e. your filter settings are not retained between browser sessions).
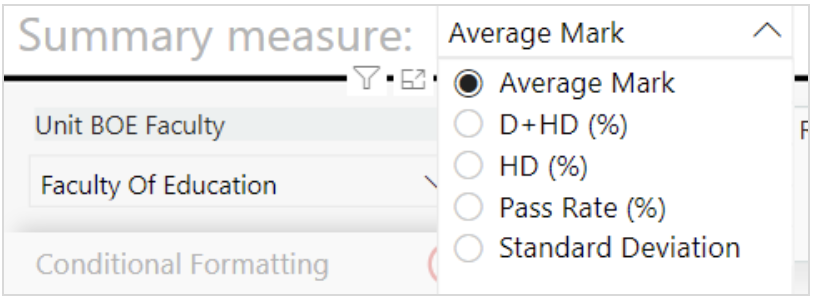
Summary
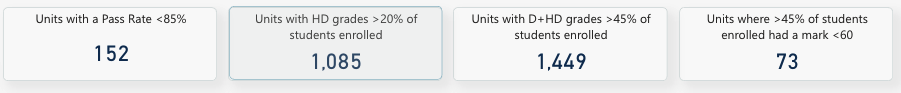
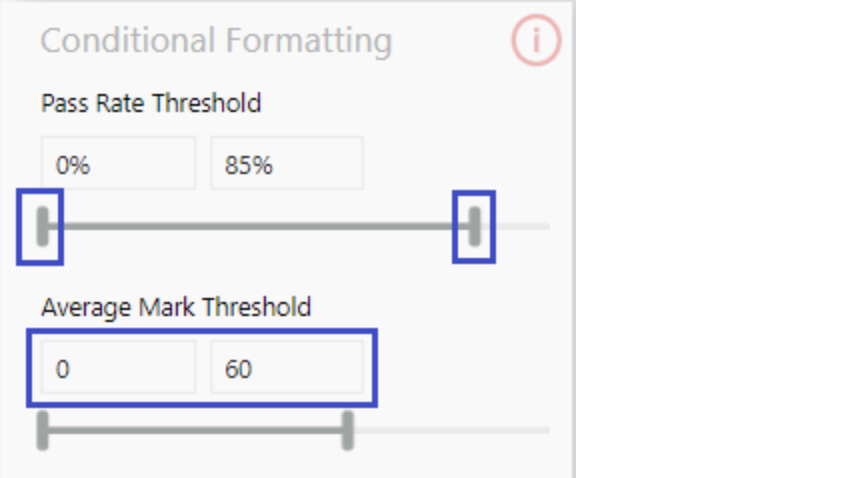
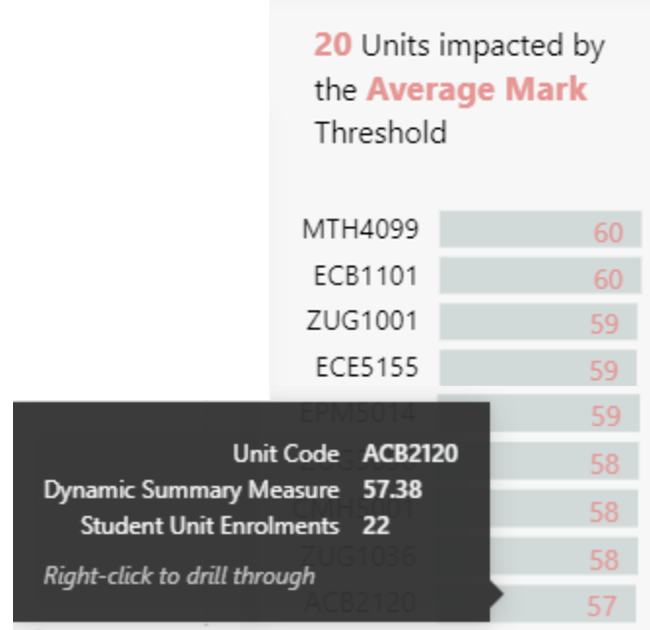
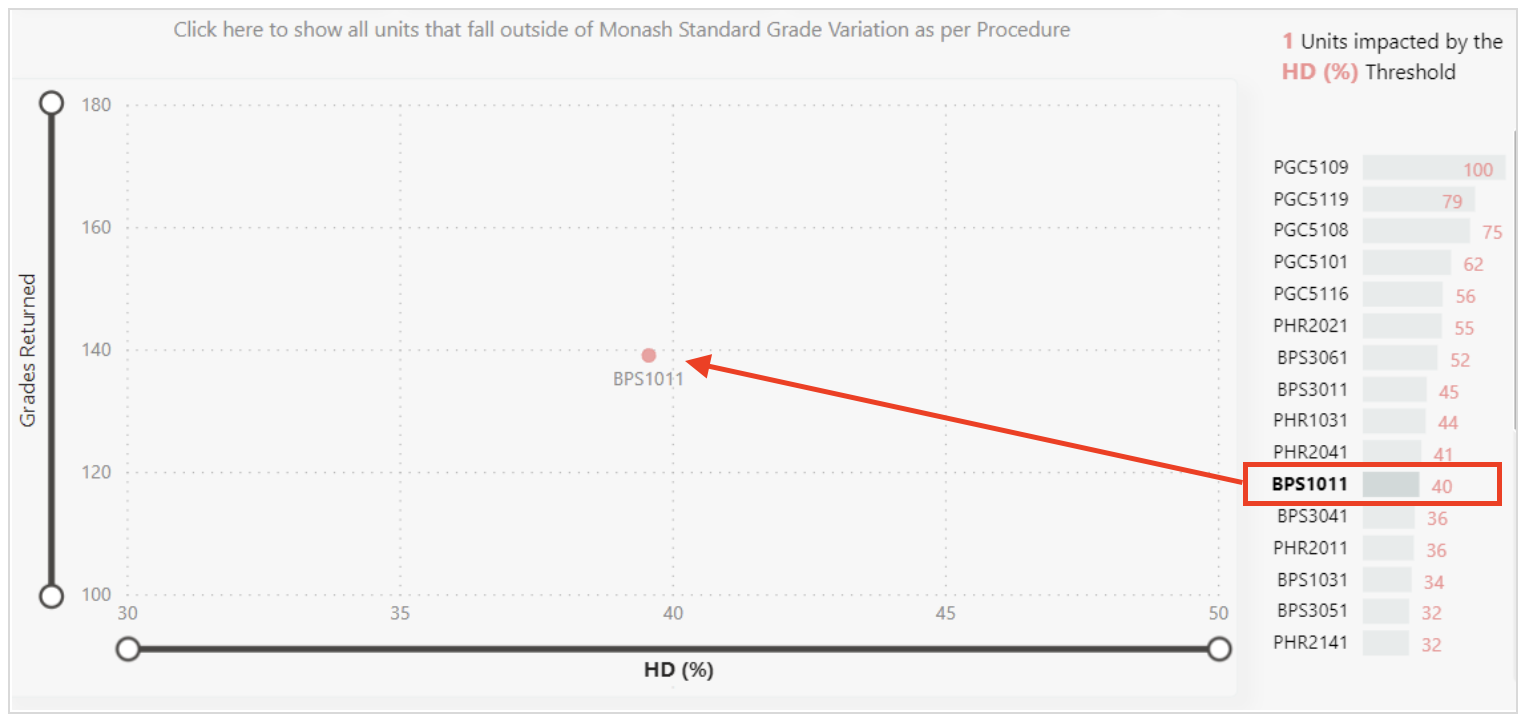
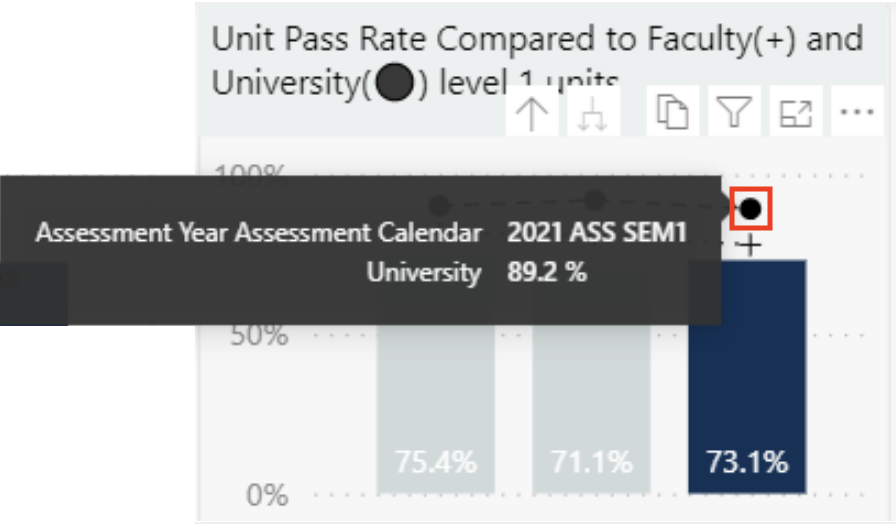
There are a number of key features in the Summary page interface. The central visual on this page is a scatter plot of units within a faculty. The units you can view in this scatter plot are determined as per your level of access enabled within this report (either you can view data for your entire faculty or for a specific department/school).
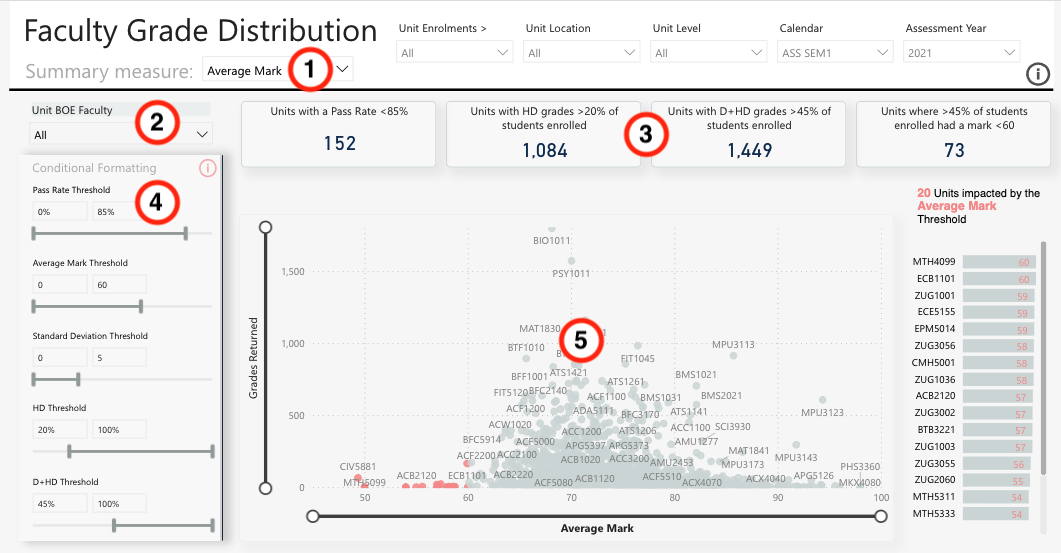
The filters you set will influence the data that is displayed in the scatter plot. Filter options for this page are as follows:


Unit View
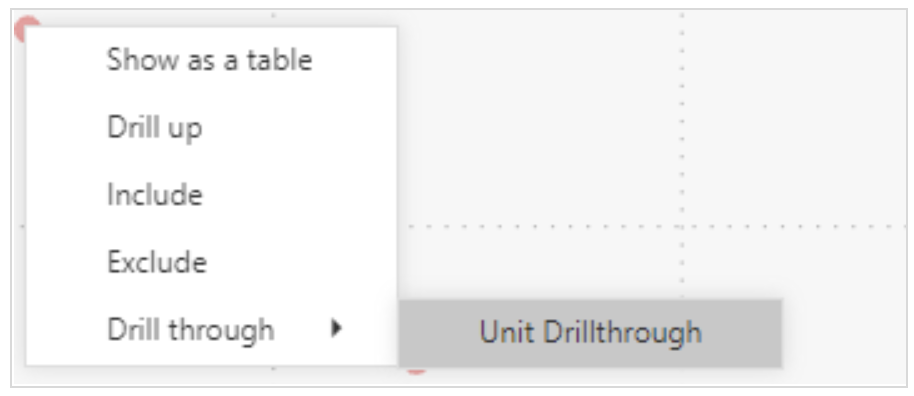
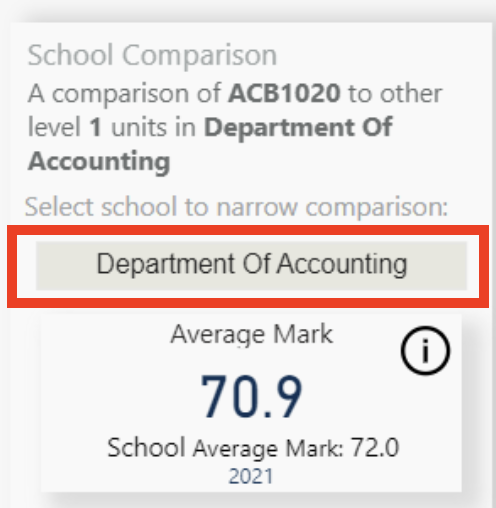
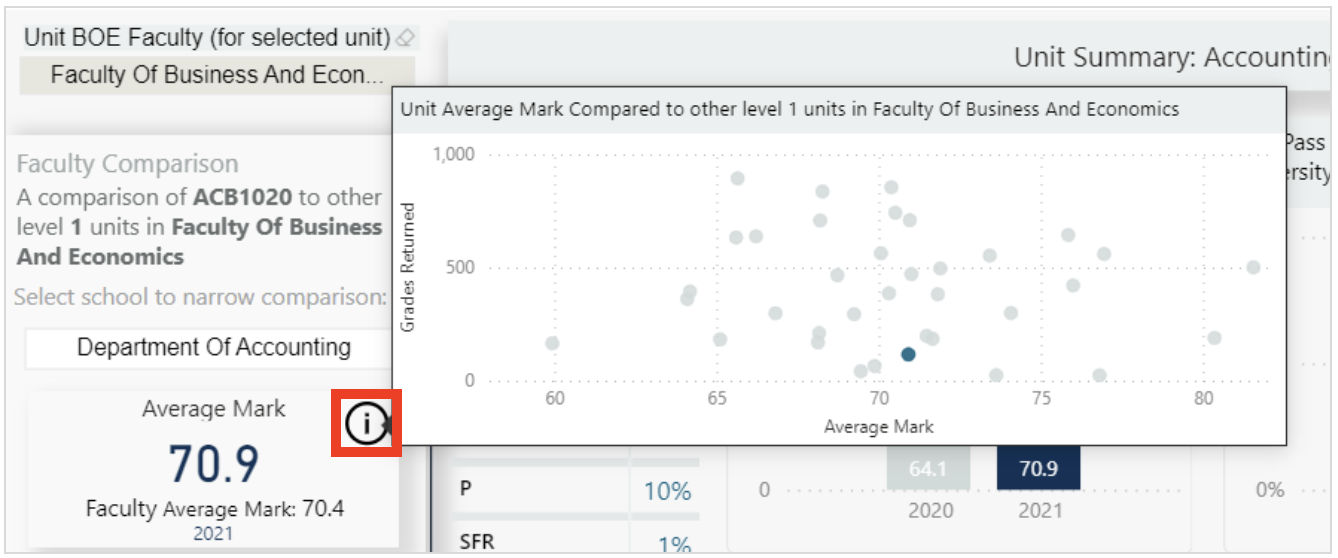
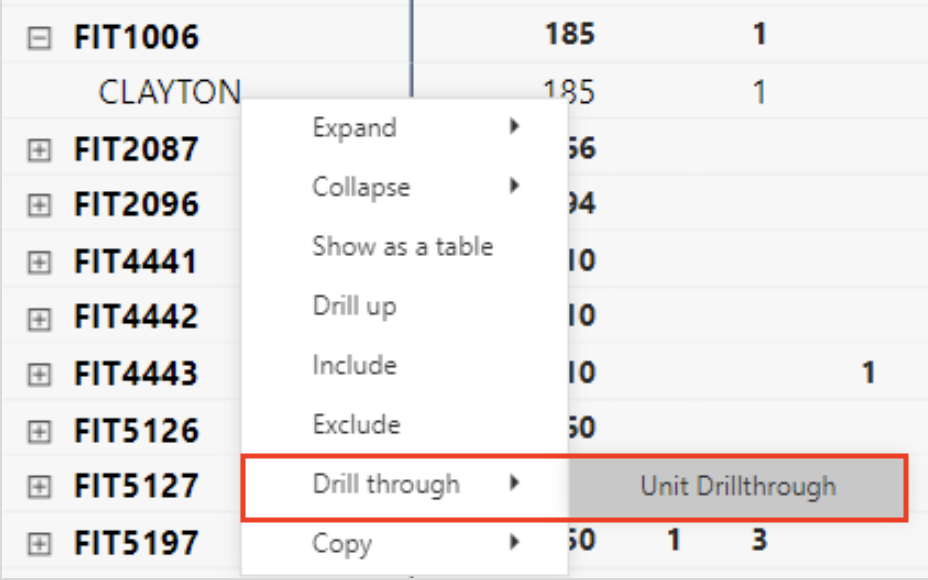
The Unit View page provides grade distribution and further analysis options for a specific unit. You can navigate to this page via right click and drilling through from a selected unit in the Summary page or Faculty Grade Distribution page.
To return from the Unit View back to the previous page you can click the back arrow next to the text Drillthrough unit.
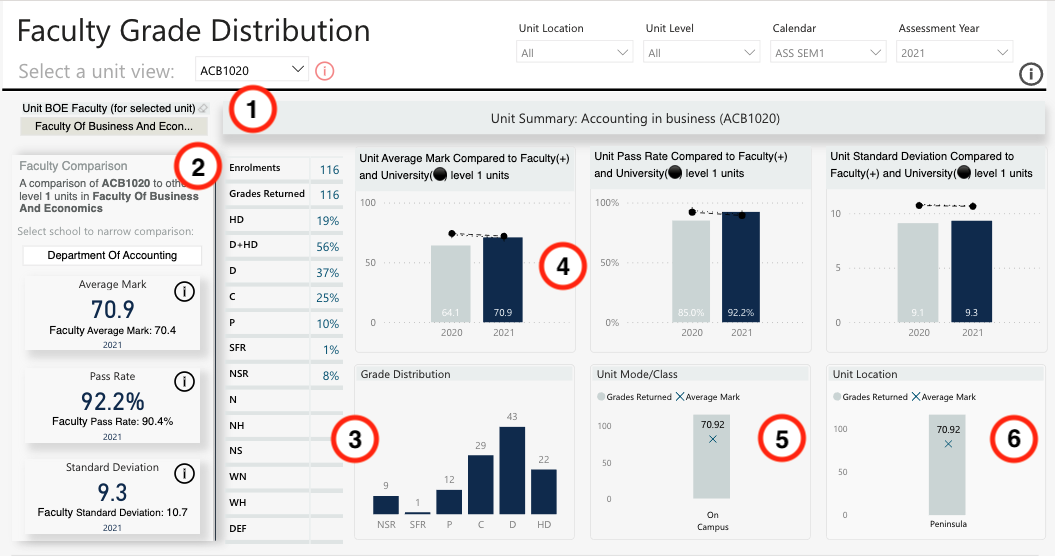
There are a number of key features in the Unit View page interface as follows:
Faculty Grade Distribution
The Faculty Grade Distribution page provides grade distribution data for a faculty, department/school and unit (per location) via an interactive table.
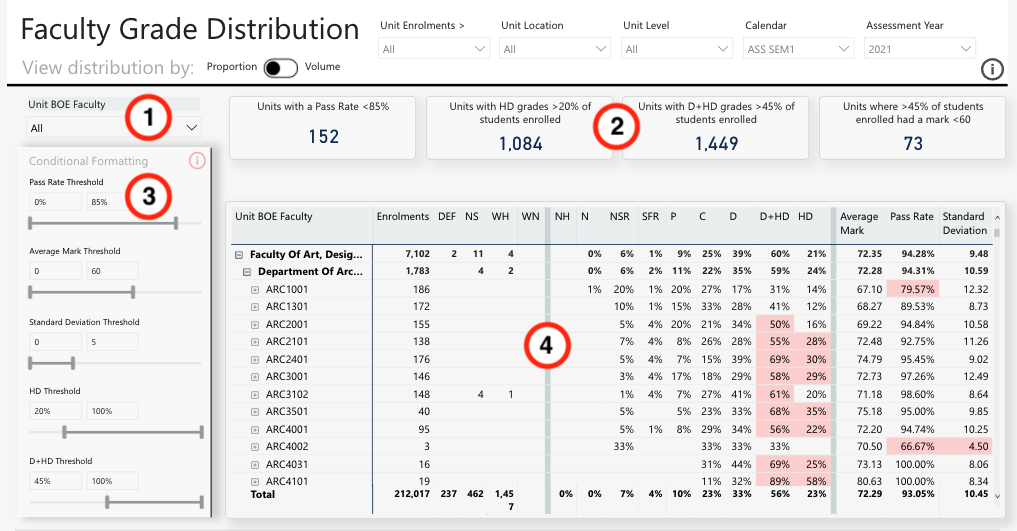
The units you can view in this table are determined as per your level of access enabled within this report (either you can view data for your entire faculty or for a specific department/school). The filters you set for the table will influence the data that is displayed accordingly. Filter options for this page are as follows:
Competency Schema
The Competency Schema page provides grade distribution data for a faculty, department/school and unit (per location) via an interactive table for competency schema units only.
The units you can view in this table are determined as per your level of access enabled within this report (either you can view data for your entire faculty or for a specific department/school). The filters you set for the table will influence the data that is displayed accordingly.
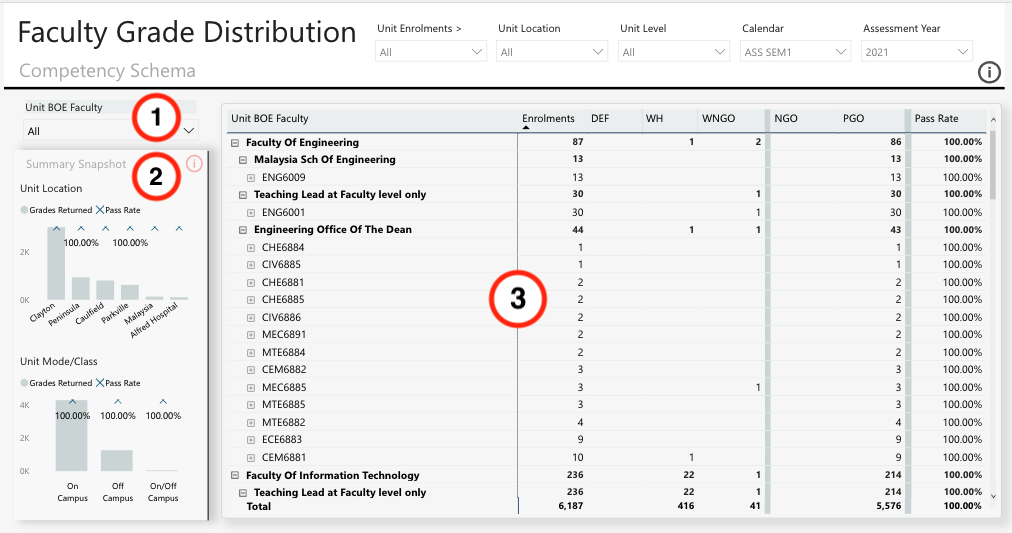
Filter options for this page are as follows: