Access learning technology analytics
Analytics are built into many learning technologies widely used at Monash University, which can provide insight into students’ engagement with learning resources including lecture recordings, recorded class material and attendance in Zoom classes.
Expand the accordions below to learn more about accessing analytics for the following technologies
 Echo360
View
Echo360
View

Echo360’s analytics page provides aggregated statistical information about student’s online engagement and participation for each recorded lecture in your unit.
Note: Only lectures that have occurred will appear in the analytics page. Scheduled future recordings will not have any recorded data. As recordings occur, data is recorded and added to the Analytics page. This data is updated daily, and it may take some time for new data to be reflected.
To access the analytics page, click on the analytics tab in the top right menu.
Class view
Select Classes from the left hand side menu.
You will see a colour coded "at a glance" breakdown of engagements, including notes, Q&A responses and slide views. Each lecture is represented by a bar in the graph. You can hover over each bar for more information.
This information is presented in grid-view at the bottom of the analytics page and contains some additional statistical information. You can sort data by clicking any column headers, click again to reverse the sort order. You can also export the data by clicking the Export button.
Live-stream views are represented by Attendance percentage. If a student 'enters the online classroom' during the live-stream, this is recorded as having attended the lecture and is not recorded as a ‘video view’. The attendance percentage shows the percentage of students in your unit that watched the live stream of the lecture.
Live-stream views are NOT recorded in 'Video views’. ‘Video view’ records the number of times students have clicked into the lecture recording AFTER the live stream has ended.
A live-viewer counter is currently on Echo’s feature development roadmap.
Student View
Select Students from the left hand side menu.
You will see student participation data for all students in the unit, rolled up across all lectures. You can view student engagement for individual lectures from the drop down list.
For more information about the metric definitions, see Metric definitions.
H5P
View
If you have H5P activities in Moodle you can use the data collected to see students progress, engagement and interactions. There are three methods for collecting data about student interaction with H5P activities in Moodle.
Collect data on opening the activity
All Moodle activities can collect data about whether a student has clicked, and presumably opened the activity. Regardless of the H5P activity you can see if a student has opened it. For H5P activities that don’t have a score, this may often be the only type of analytical data you can capture.

The Moodle Activity completion guide has more information about using this process for any Moodle activity.
Collect data on completing the activity
The progress of students completing H5P activities can be tracked and stored in the Moodle gradebook for some types of H5P activities. A gradebook record is automatically created for any H5P activity placed in a unit that has a score.
For some H5P activity types, a simple score is recorded, typically ‘1’ for complete and ‘0’ for incomplete. This can be combined with Moodle activity completion to record a student who has finished a H5P activity, regardless of a specific score.
Unlike Moodle native quizzes, H5P can’t require a specific grade (eg. 75%) to be completed as an activity completion setting.
Collect data on a specific score

For some types of H5P activities, a specific score can be recorded that reflects a student’s ability to complete the H5P task. The score recorded is related to the number of correct responses that the user can take.
For example, if you have five draggable objects that need to be correctly placed, the user can get a total score of five.

Some H5P activities allow this total score to be replaced with a simple ‘1’ for the task being completed. This may be useful if you just need to know ‘complete’ or ‘incomplete’ student progress, and can tie into the activity completion option above.
You can also remap the H5P score to a different scale for the Moodle gradebook in the Moodle settings. This section also allows you to assign a category for the score in the gradebook.
These features may be useful for several purposes:

You can put all formative tasks into a separate category eg. “formative” in the gradebook and weigh all of the tasks to be worth 0%. This means you can track student progress, but this won’t affect summative grades. More details about setting up and using the gradebook can be found in the gradebook guide.
Panopto
View
Panopto allows you to view a range of statistics for individual Panopto sessions, Panopto folders and individual viewers. You can download statistics using the download icon in the top right corner of the graph visualisations. Statistics will be downloaded as a .zip file containing a .csv file. By default, statistics are downloaded from the Last 30 days. To change the time frame, adjust the dropdown list in the top right corner of the analytics page before clicking download.
View Panopto video statistics
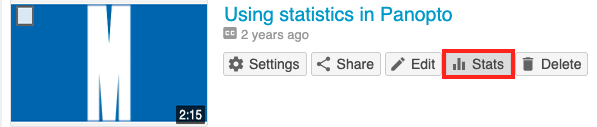
- Navigate to the session that you want to view statistics for.
- Hover over the session and click on the Stats icon.
- The Session Dashboard will open in a new window, which displays a range of statistics. By default, statistics from the Last 30 days will be displayed. You can use the dropdown list to view statistics from the Last 7 days, Last 90 days, Any Time or a custom time range.
- Click through the tabs below to learn more about each graph.
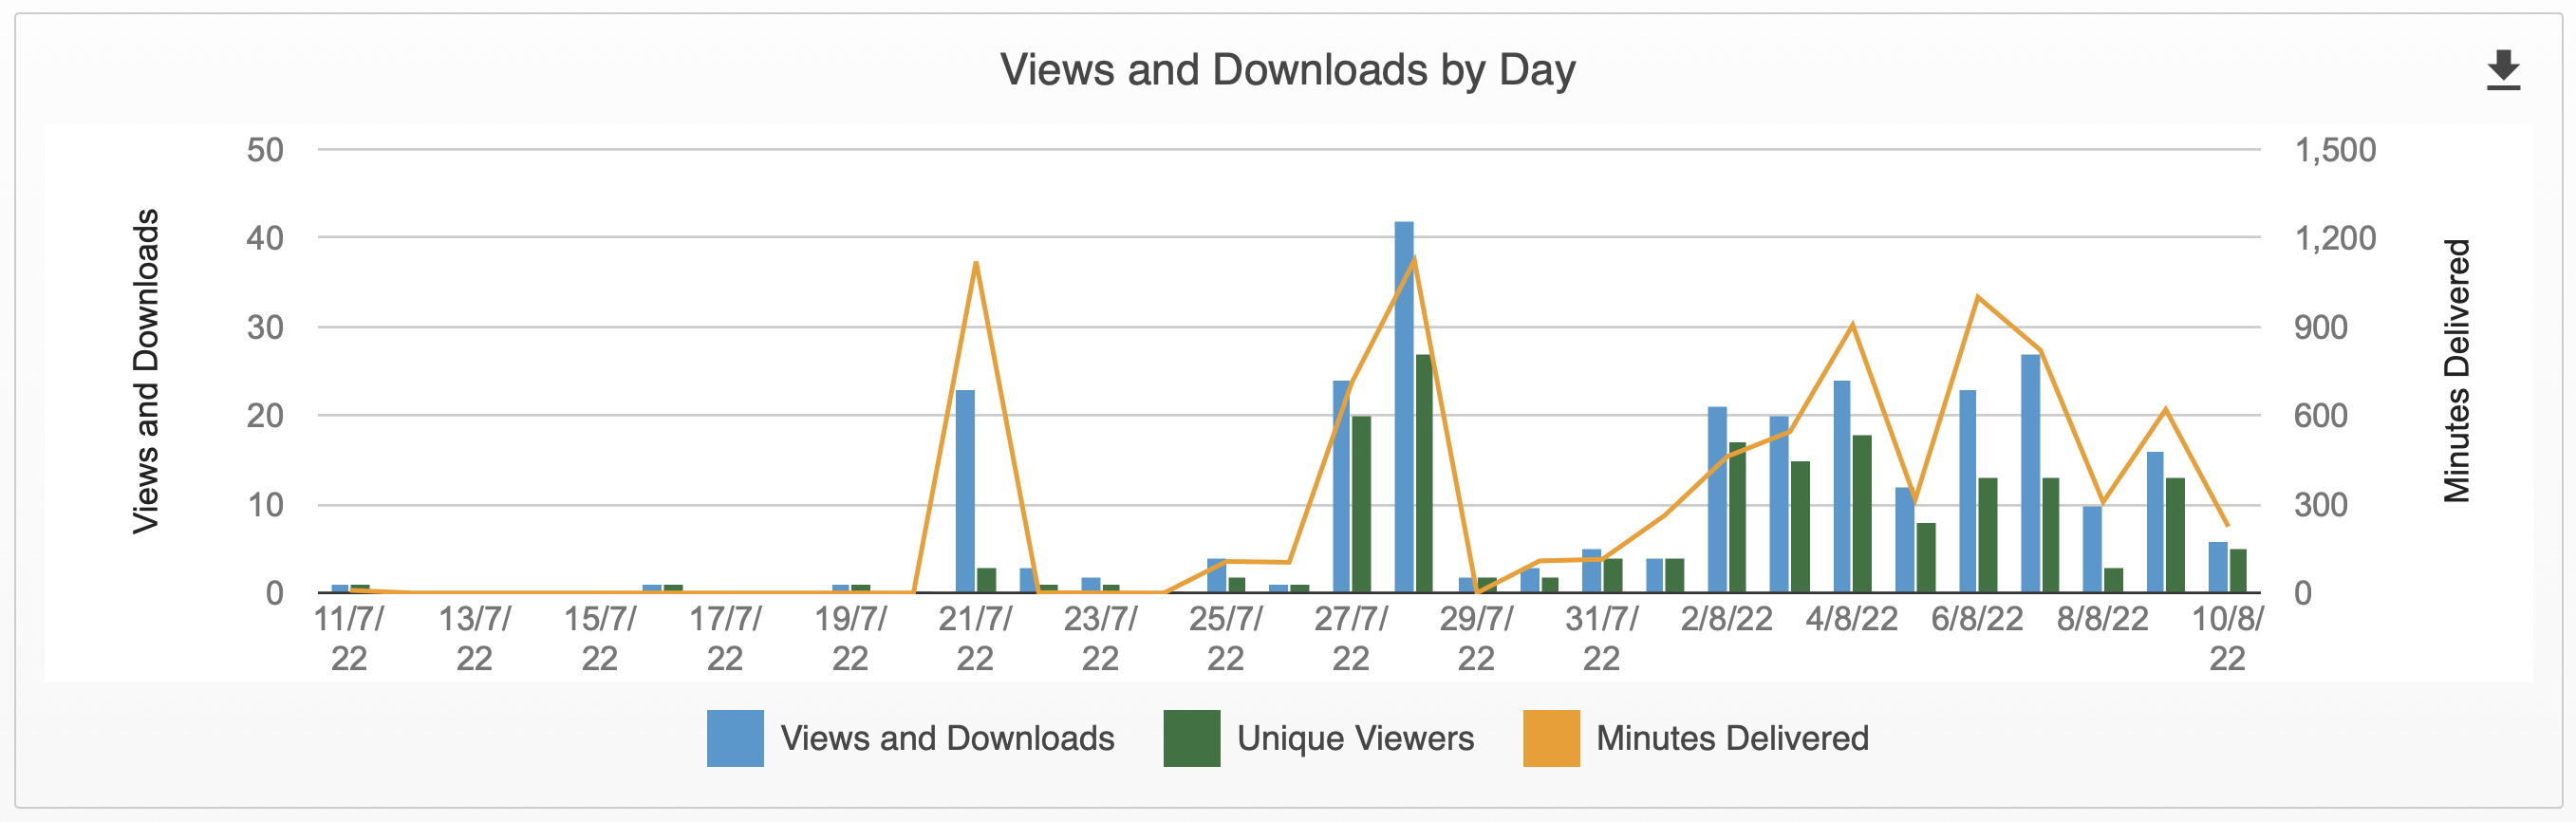
In the Views and Downloads by Day graph, you can view the number of:
- Views
- Unique visitors(viewers)
- Minutes delivered(watched)
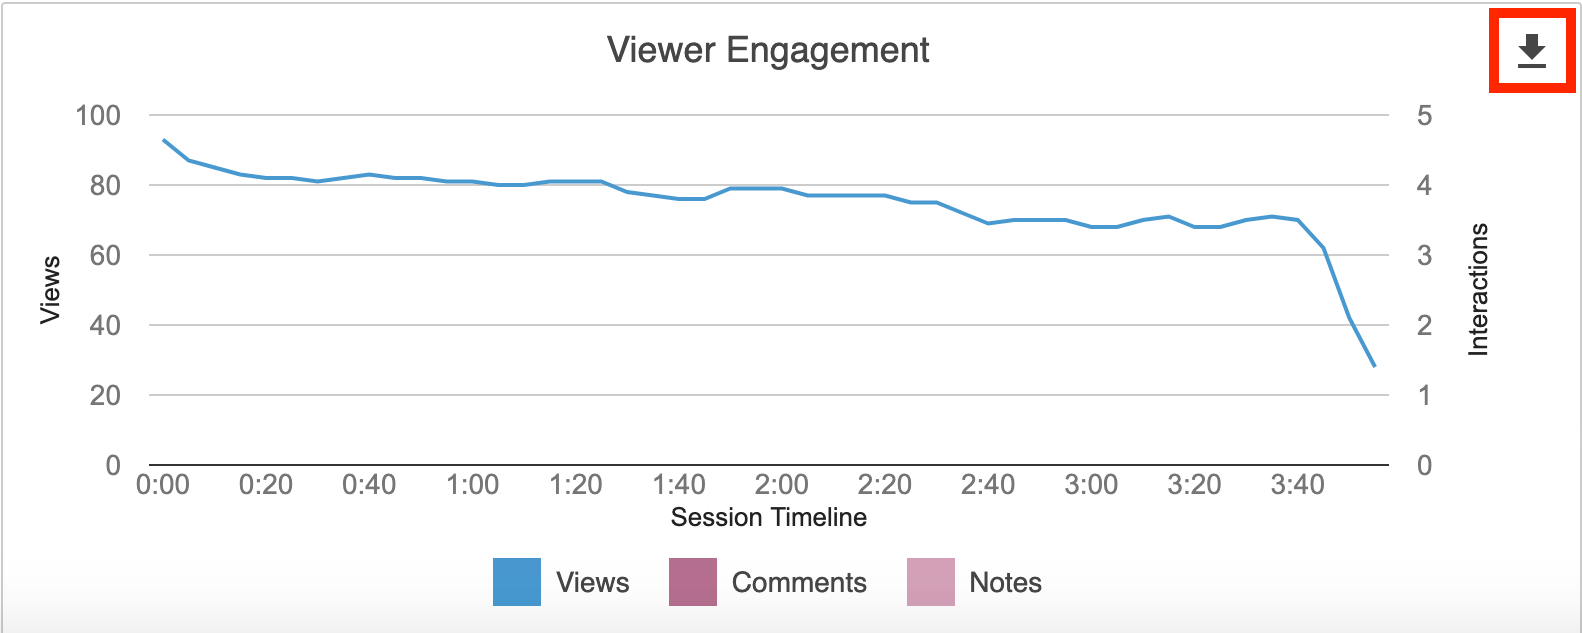
You can view the level of engagement throughout the length of the video, as well as any discussion comments or notes that have been left on the video.
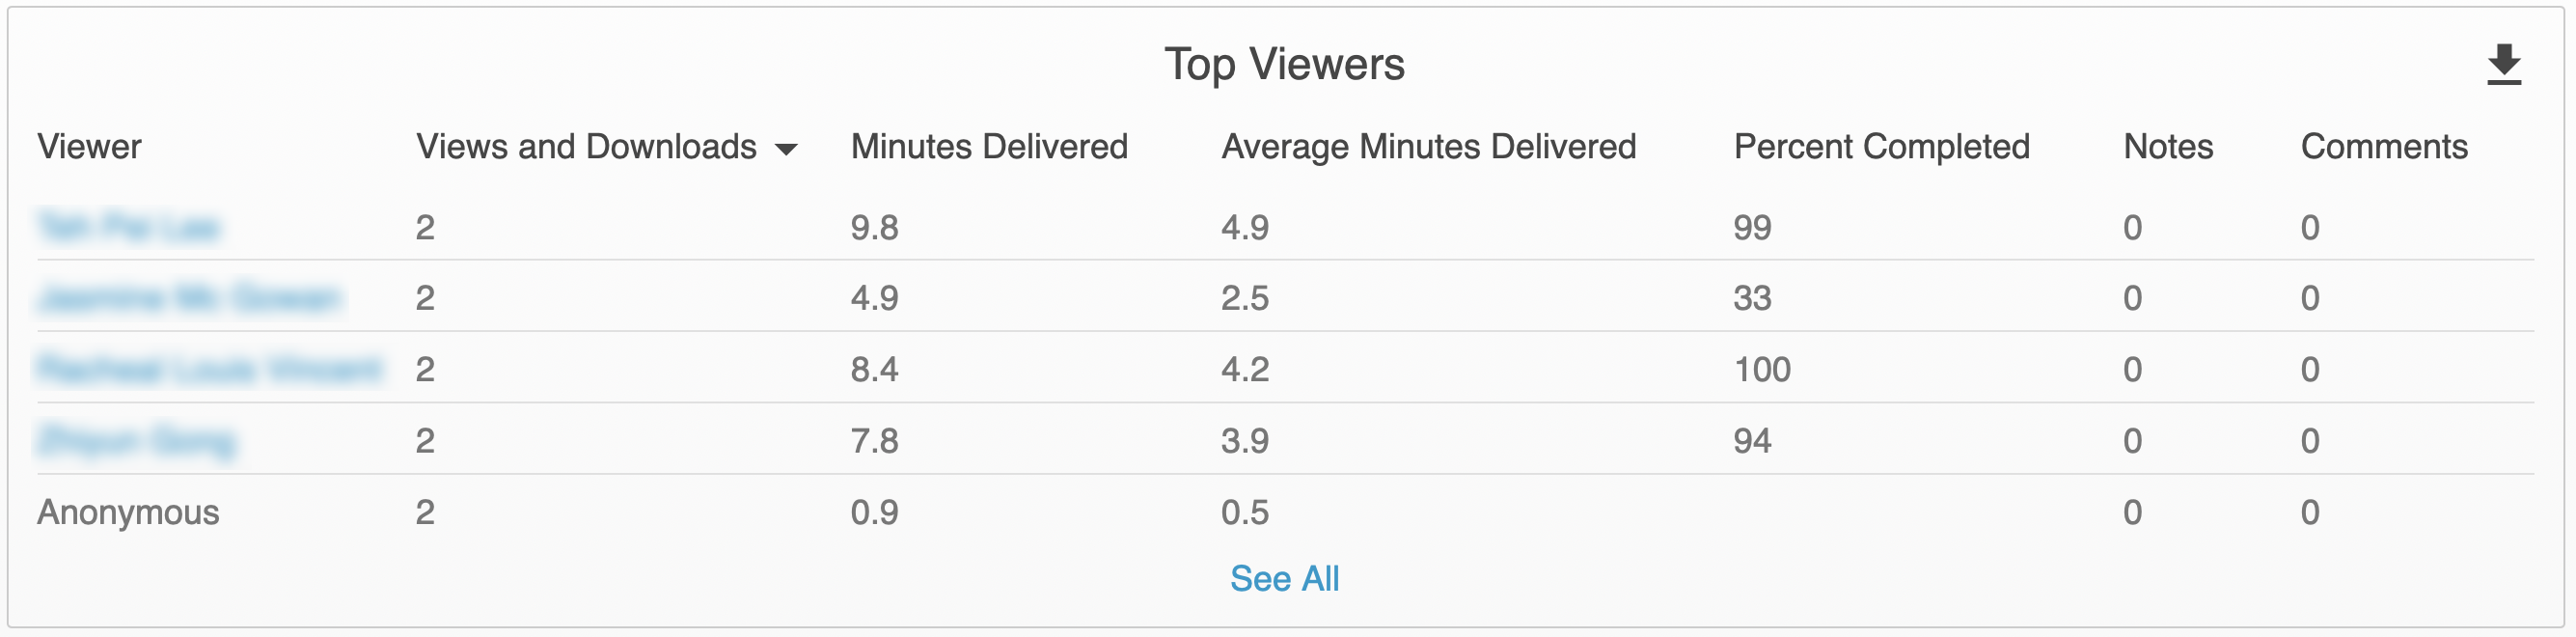
Under Top Viewers, you can view information about the top viewers which have watched the session. You will be able to see the number of Views, Minutes Delivered(watched), Avg. Minutes Delivered, Percent Completed, Notes and Comments that a viewer has made.
- Click Views in the header to sort from lowest to highest or highest to lowest.
- To expand the list and view all viewers of the session, click See All.
- Users which are not logged in will appear aggregated as Anonymous. Unique users will have their name displayed.
You can click on their name to see data about the sessions they have viewed. For more information, see View Individual User statistics.
In Download reports, you can click the links to download the report for:
- Views by Day
- Viewer Engagement
- Top Viewers
View Panopto folder statistics
- Navigate to the Panopto folder you want to view statistics.
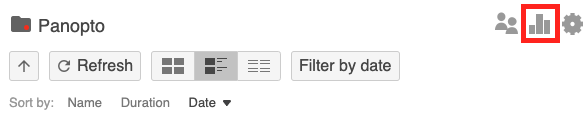
- Click on the Stats icon in the top right corner of the screen.
- The Folder Dashboard will open in a new window, which displays a range of statistics. By default, statistics from the Last 30 days will be displayed. You can use the dropdown list to view statistics from the Last 7 days, Last 90 days, Any Time or a custom time rage.
- Click through the tabs below to learn more about each graph.
For all videos inside the folder(including subfolders) you can view the total number of:
- Views
- Unique visitors(viewers)
- Minutes delivered(watched)

If you have set up subfolders within your folder, under Subfolder Roll-up, you can view a breakdown of Views and Minutes delivered(Minutes watched) across all subfolders.
Use the dropdown list to switch between Views and Downloads and Minutes delivered. You can hover over the graph visualisation for exact figures and subfolder highlights.

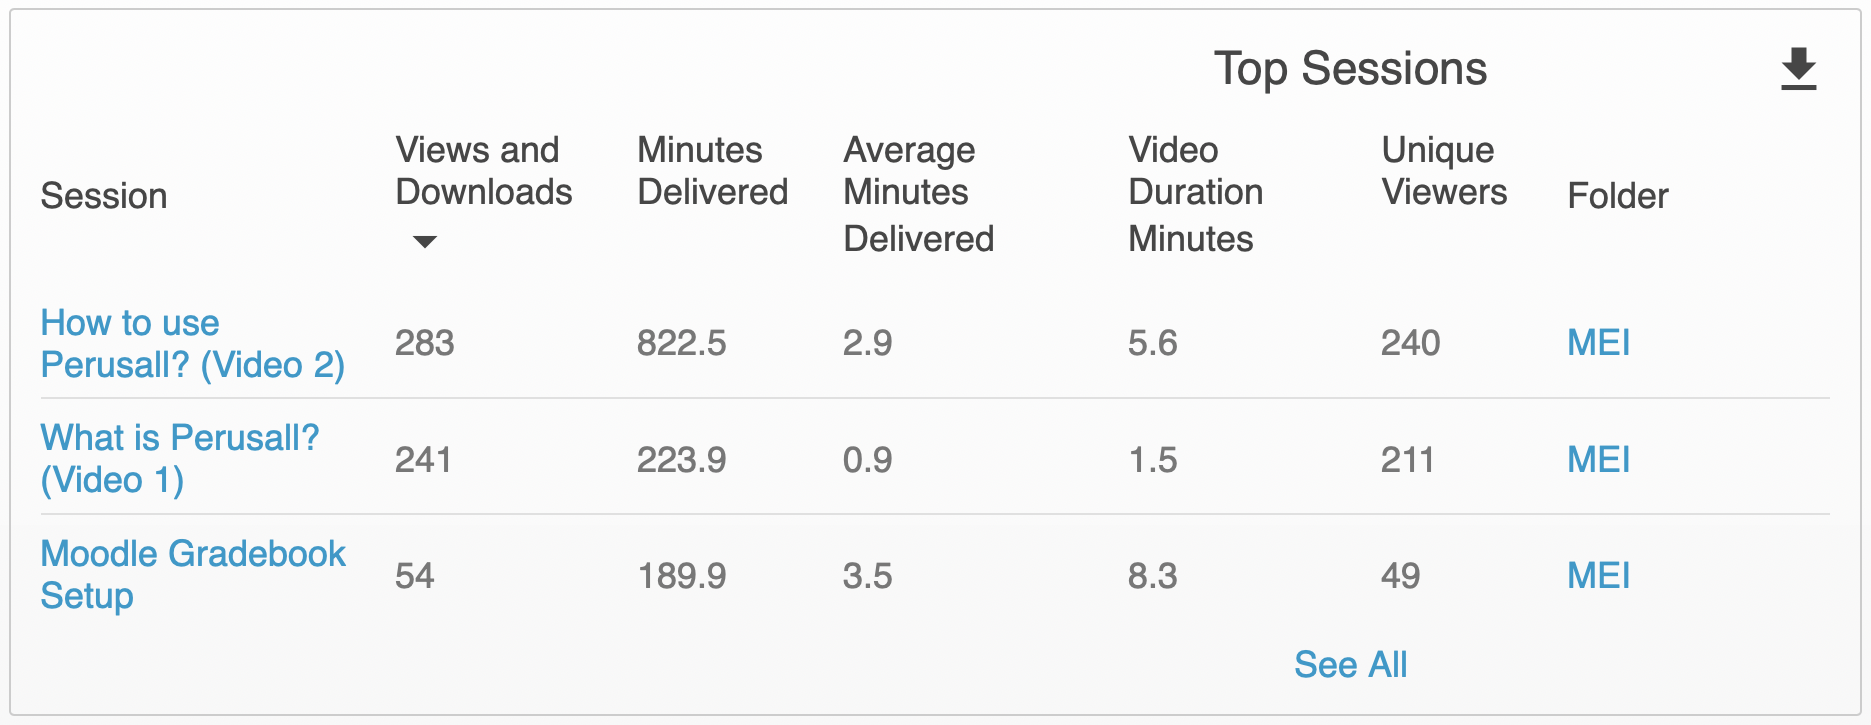
Under Top Sessions, you can view information about the top videos which have been watched within a folder. You will be able to see the:
- Number of Views
- Minutes Delivered(watched)
- Average minutes viewed
- Number of unique visitors
- Information about the folder the video sits under and top-level folder(if applicable)
- The creator of the video.
You can click Views in the header to sort from lowest to highest or highest to lowest. To expand the list and view all videos within the folder, click See All.

In Download reports, you can click the links to download the report for:
- Views and Downloads by Day
- Top Viewers
- User Completion
View Individual User statistics
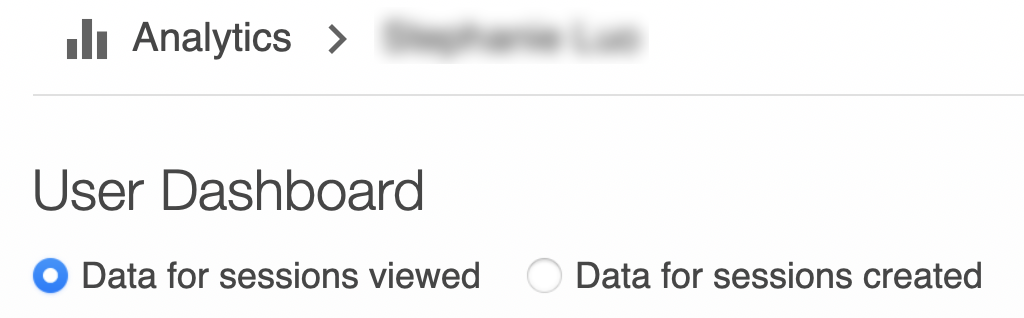
From the Top Viewers graph, you can click on the name of a viewer or a creator to view information about their individual user statistics. You can toggle between the User Dashboard and the Creator Dashboard with the radio buttons at the top of the Analytics page.
Click through the tabs below to learn more about each graph.
- Views and Downloads by Day
- Top Sessions Viewed by User
- Top Sessions (Created by User)
- Download reports
In the Views and Downloads by Day graph, you can view the number of:
- Views
- Unique visitors(viewers)
- Minutes delivered(watched)
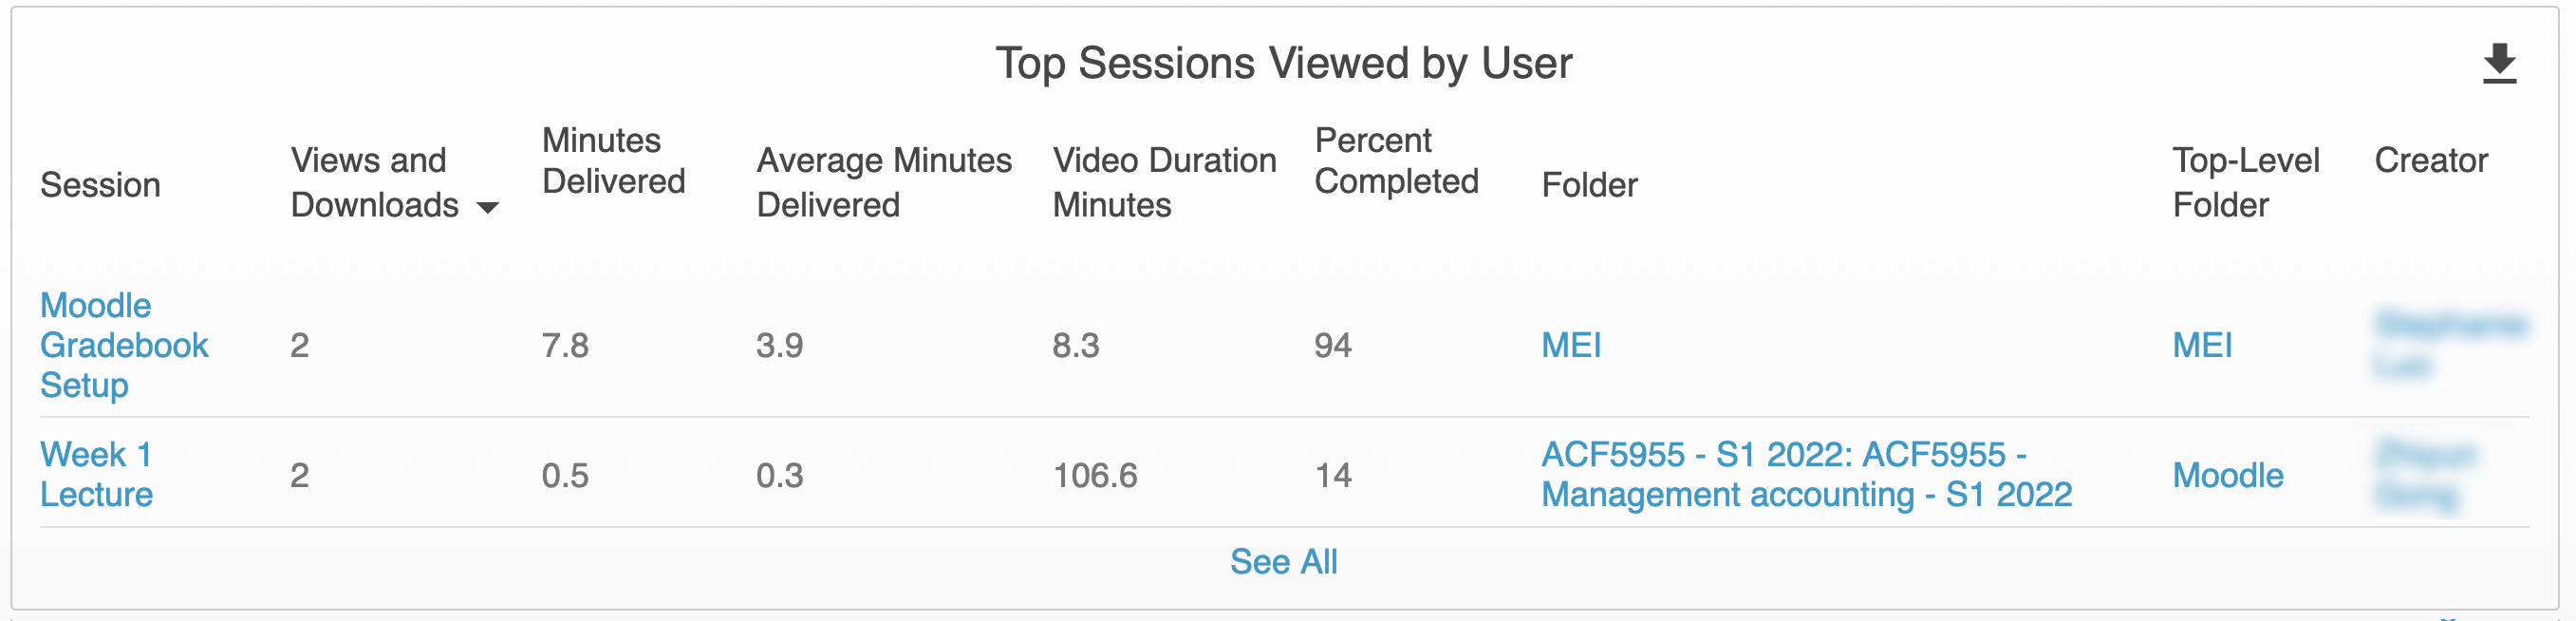
In Top Sessions Viewed by User (User Dashboard), in order of the most to least watched session, you can view:
- The name of the sessions viewed
- Number of views per session
- Minutes delivered(watched)
- Average minutes viewed
- Percentage of the video completed
- The folder the video sits under and top-level folder(if applicable), as well as the creator of the video.
In Top Sessions (Creator Dashboard), in order of the most viewed to least viewed, you can view information about sessions that the user has created, including:
- The name of the sessions
- Number of views and download per session
- Minutes delivered (watched)
- Average minutes viewed
- Video length
- Number of unique viewers
- The folder the video sits under and top-level folder(if applicable).
In Download reports, you can click the links to download the report for:
- Views and Downloads by Day
- Top Sessions Viewed by User (User Dashboard)
- Top Viewers (Creator dashboard)
In Download reports, you can click the links to download the report for:
- Views and Downloads by Day
- Top Sessions Viewed by User
Zoom
View
Zoom creates reports about participant attendance in Zoom sessions, which includes information about time and duration of access. Reports can be useful to take attendance as well as to identify the length of time students are logged into the online session. Reports can be accessed 15 mins after the Zoom meeting. You need to be the creator of the Zoom meeting to be able to see the report.
To access the Meeting participants report:
- Login to your Zoom account at https://monash.zoom.us
- Click on Reports in the left hand menu.
- Under the Usage Report tab, select Meeting and Webinar history.
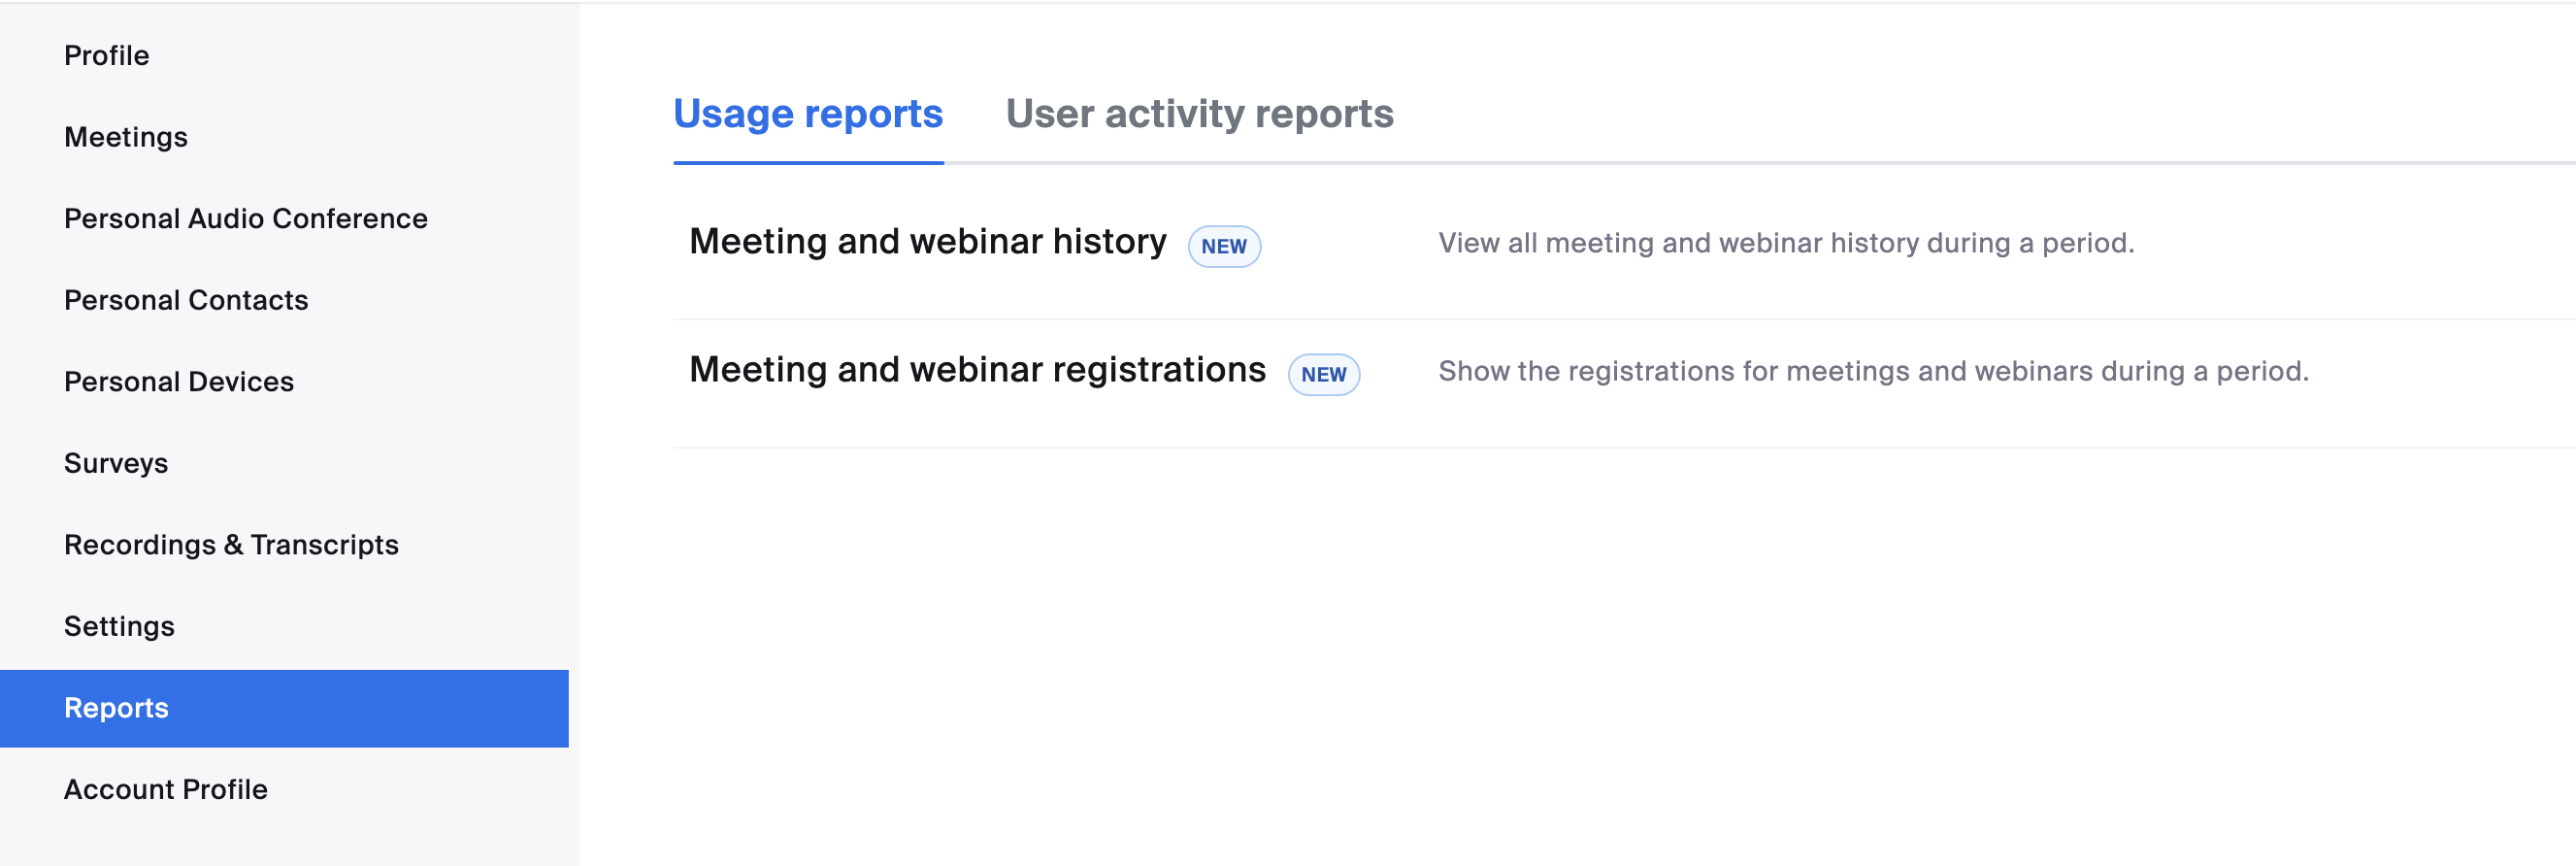
- Specify a time frame with the From and To fields, then click Search.

Note: Zoom will only generate reports up to a range of 1 month. If you need to view reports across a longer period of time, you may need to adjust the specified timeframe and search multiple times.
- You will see a list of Zoom meetings you created that occurred within the specified timeframe.
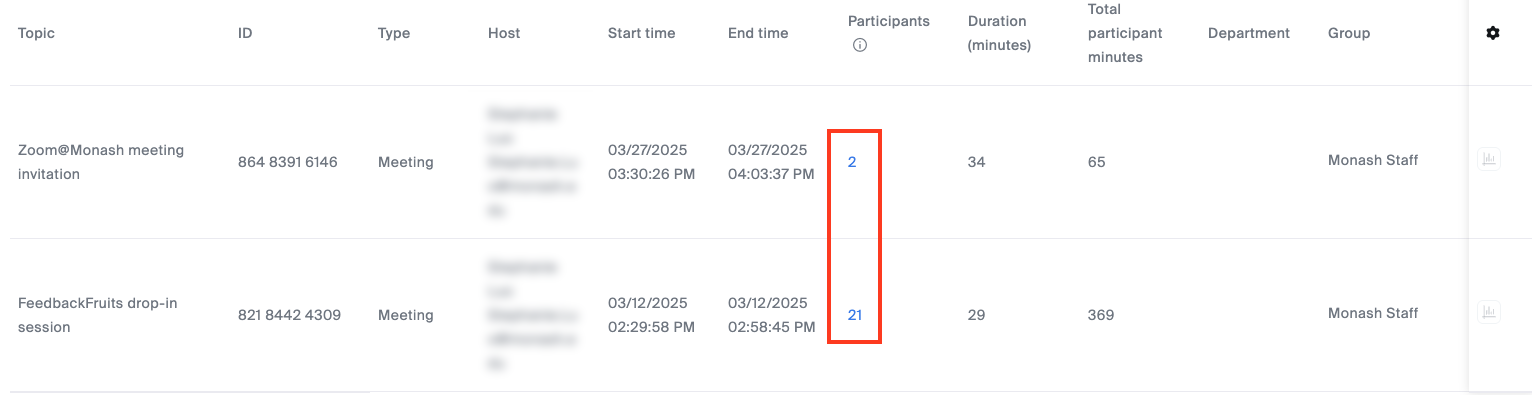
- For the meeting that you would like to view the meeting participants, click on the number in the participants column.
- You will see the list of participants who attended your Zoom meeting, including their user email, their join time, leave time, total minutes spent in the meeting, if they joined as a guest, if the meeting was recorded and if participants were in the waiting room. Multiple logins may indicate technical difficulties for the user.
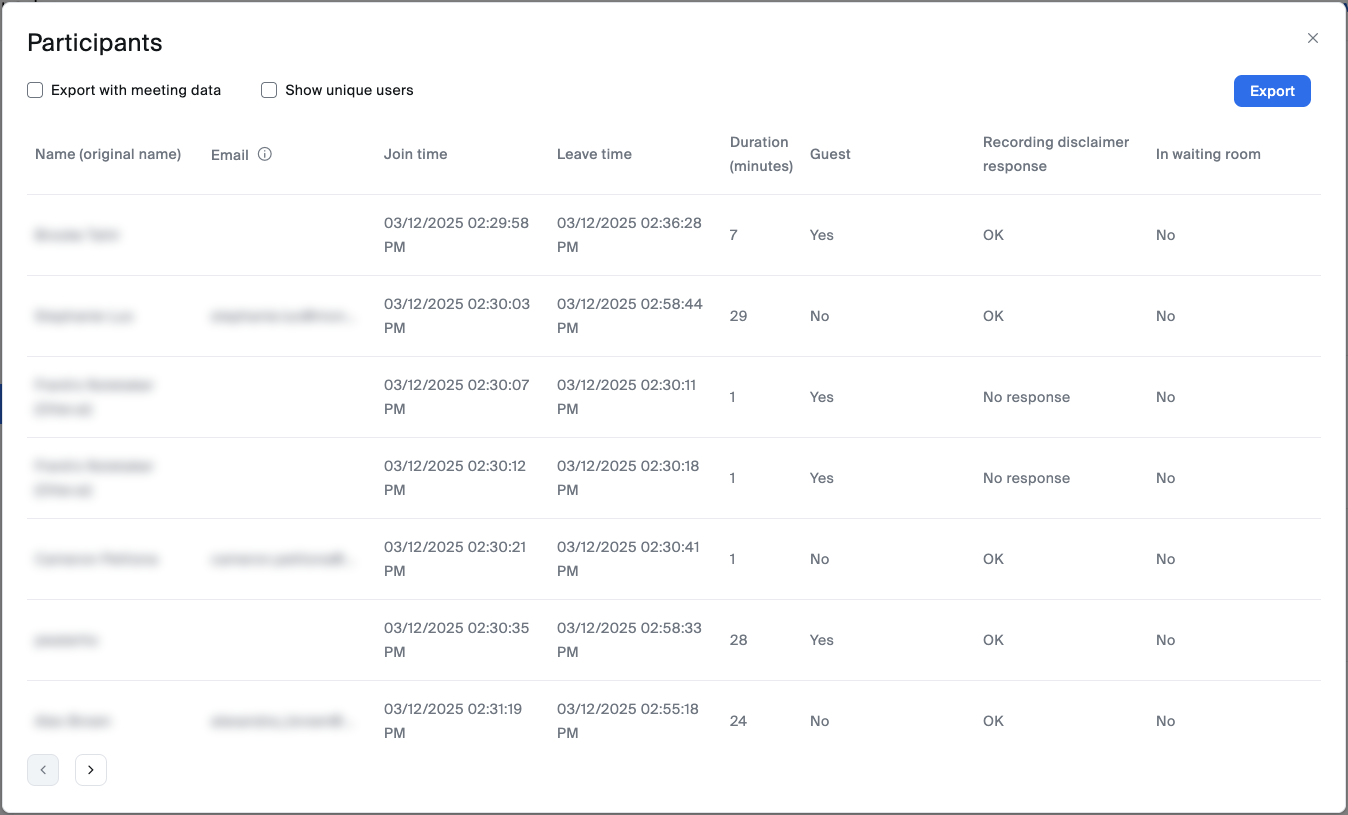
Note: If a participant joins the Zoom meeting without logging in to their Monash Zoom account, you will only see the name they chose when joining the meeting and not their email address. You can check Only Authenticated Users can join in the Zoom meeting settings via monash.zoom.us to force participants to sign in to access the Zoom session.
However, this is NOT recommended as it may make the Zoom meeting less accessible for students using different devices.
- Click Export to download a copy of the Meeting participants report to your computer.