Use Moodle Analytics Graphs
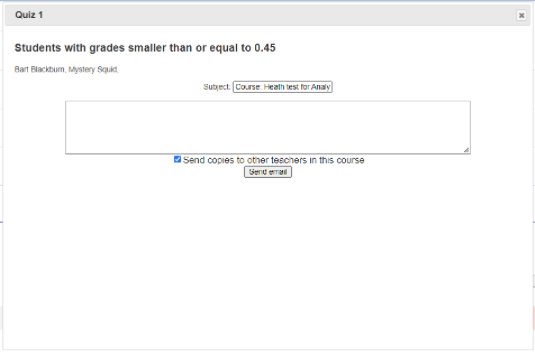
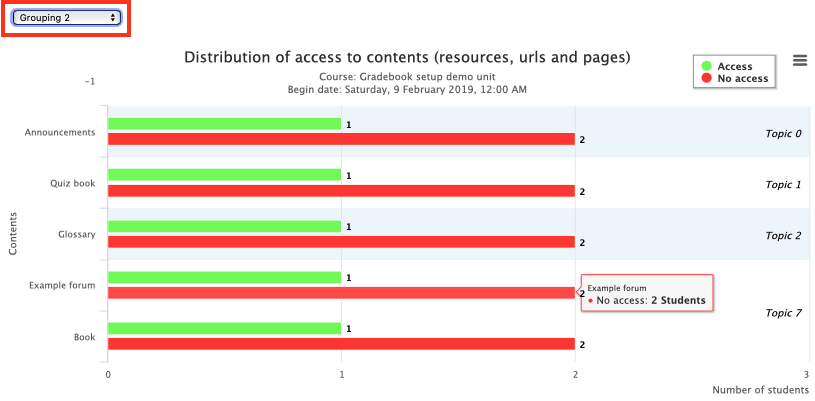
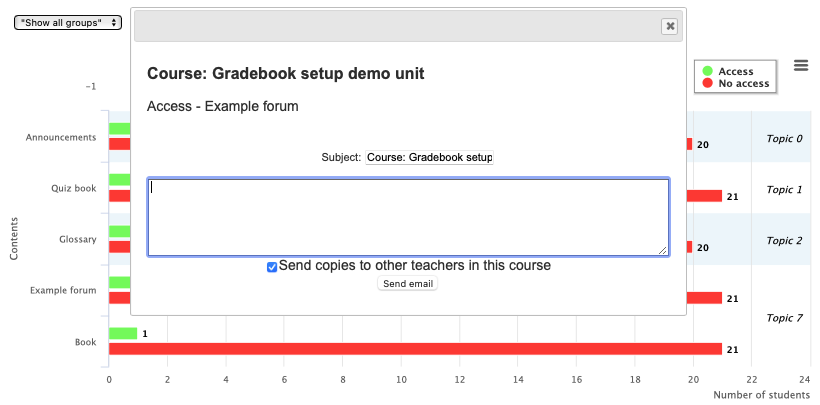
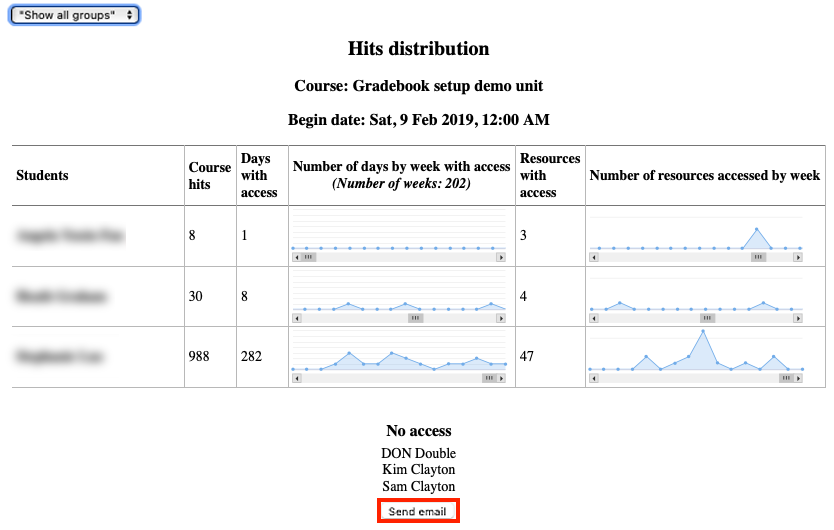
The Moodle Analytics Graphs block provides a range of graphs based on data within a Moodle unit. With the Moodle Analytics Graphs block you can quickly and easily send emails to students based on different criteria, such as students who have failed to submit to an assignment on time, who have not yet accessed the Moodle unit or specific unit resource, or who have scored below a threshold grade. This allows you to send targeted messages to students who may need additional support.
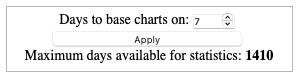
NoteThese reports may take a few minutes to generate. If possible, run these reports outside of busy hours, or run them for groups rather than the whole unit. |
Add the Moodle Analytics Graphs block
- Switch Edit mode on(Blue) in the top left of the page.
- Expand the left side panel with the arrow and click the Add a Block button.
- Select Analytics Graphs.
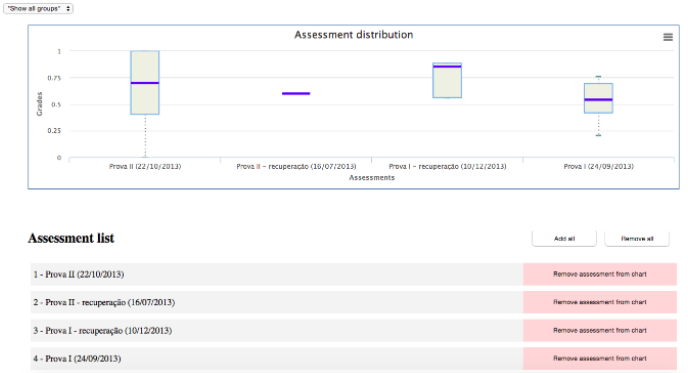
- When the block is added, it will appear on the right hand side with the other unit blocks.
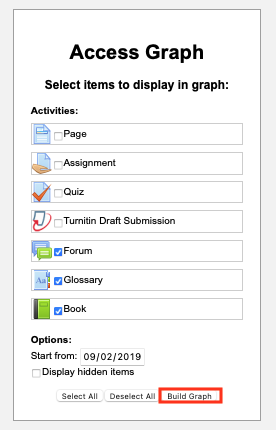
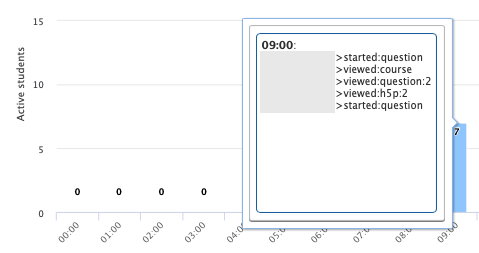
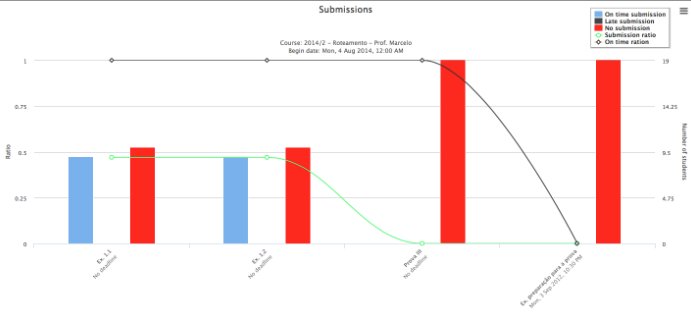
- Click on the name of the graph to view the graph. The graph will open in a new tab.
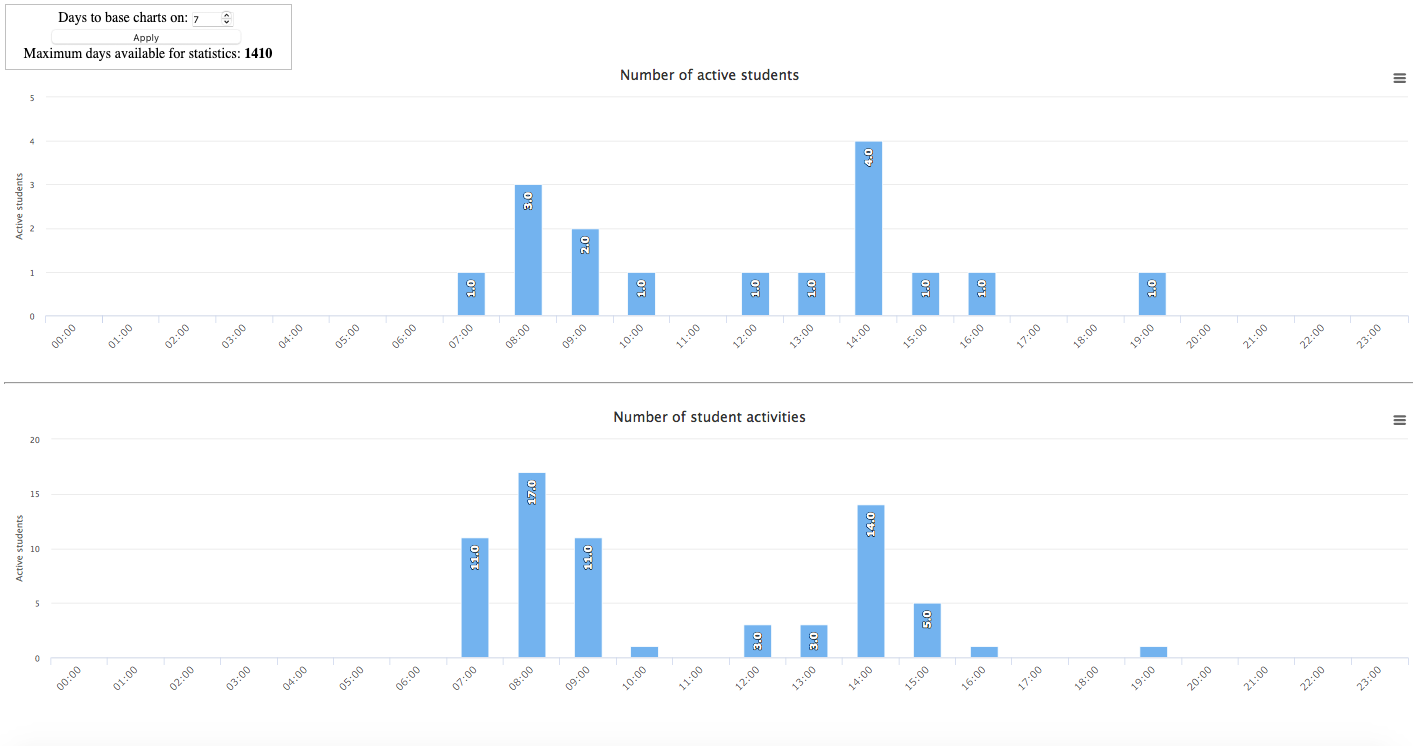
Expand the accordions below to learn more about each graph
NoteThis tool is the first generation of analytics tools for Moodle. If you have any feedback or suggestions, please contact us through the feedback form below. |