View Panopto statistics and analytics
Panopto allows you to view a range of statistics for individual Panopto sessions, Panopto folders and individual viewers. You can download statistics using the download icon in the top right corner of the graph visualisations. Statistics will be downloaded as a .zip file containing a .csv file. By default, statistics are downloaded from the Last 30 days. To change the time frame, adjust the dropdown list in the top right corner of the analytics page before clicking download.
View Panopto video statistics
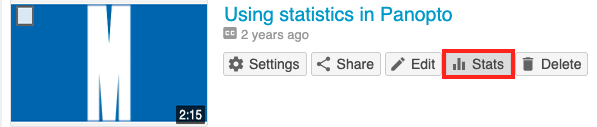
- Navigate to the session that you want to view statistics for.
- Hover over the session and click on the Stats icon.
- The Session Dashboard will open in a new window, which displays a range of statistics. By default, statistics from the Last 30 days will be displayed. You can use the dropdown list to view statistics from the Last 7 days, Last 90 days, Any Time or a custom time range.
- Click through the tabs below to learn more about each graph.
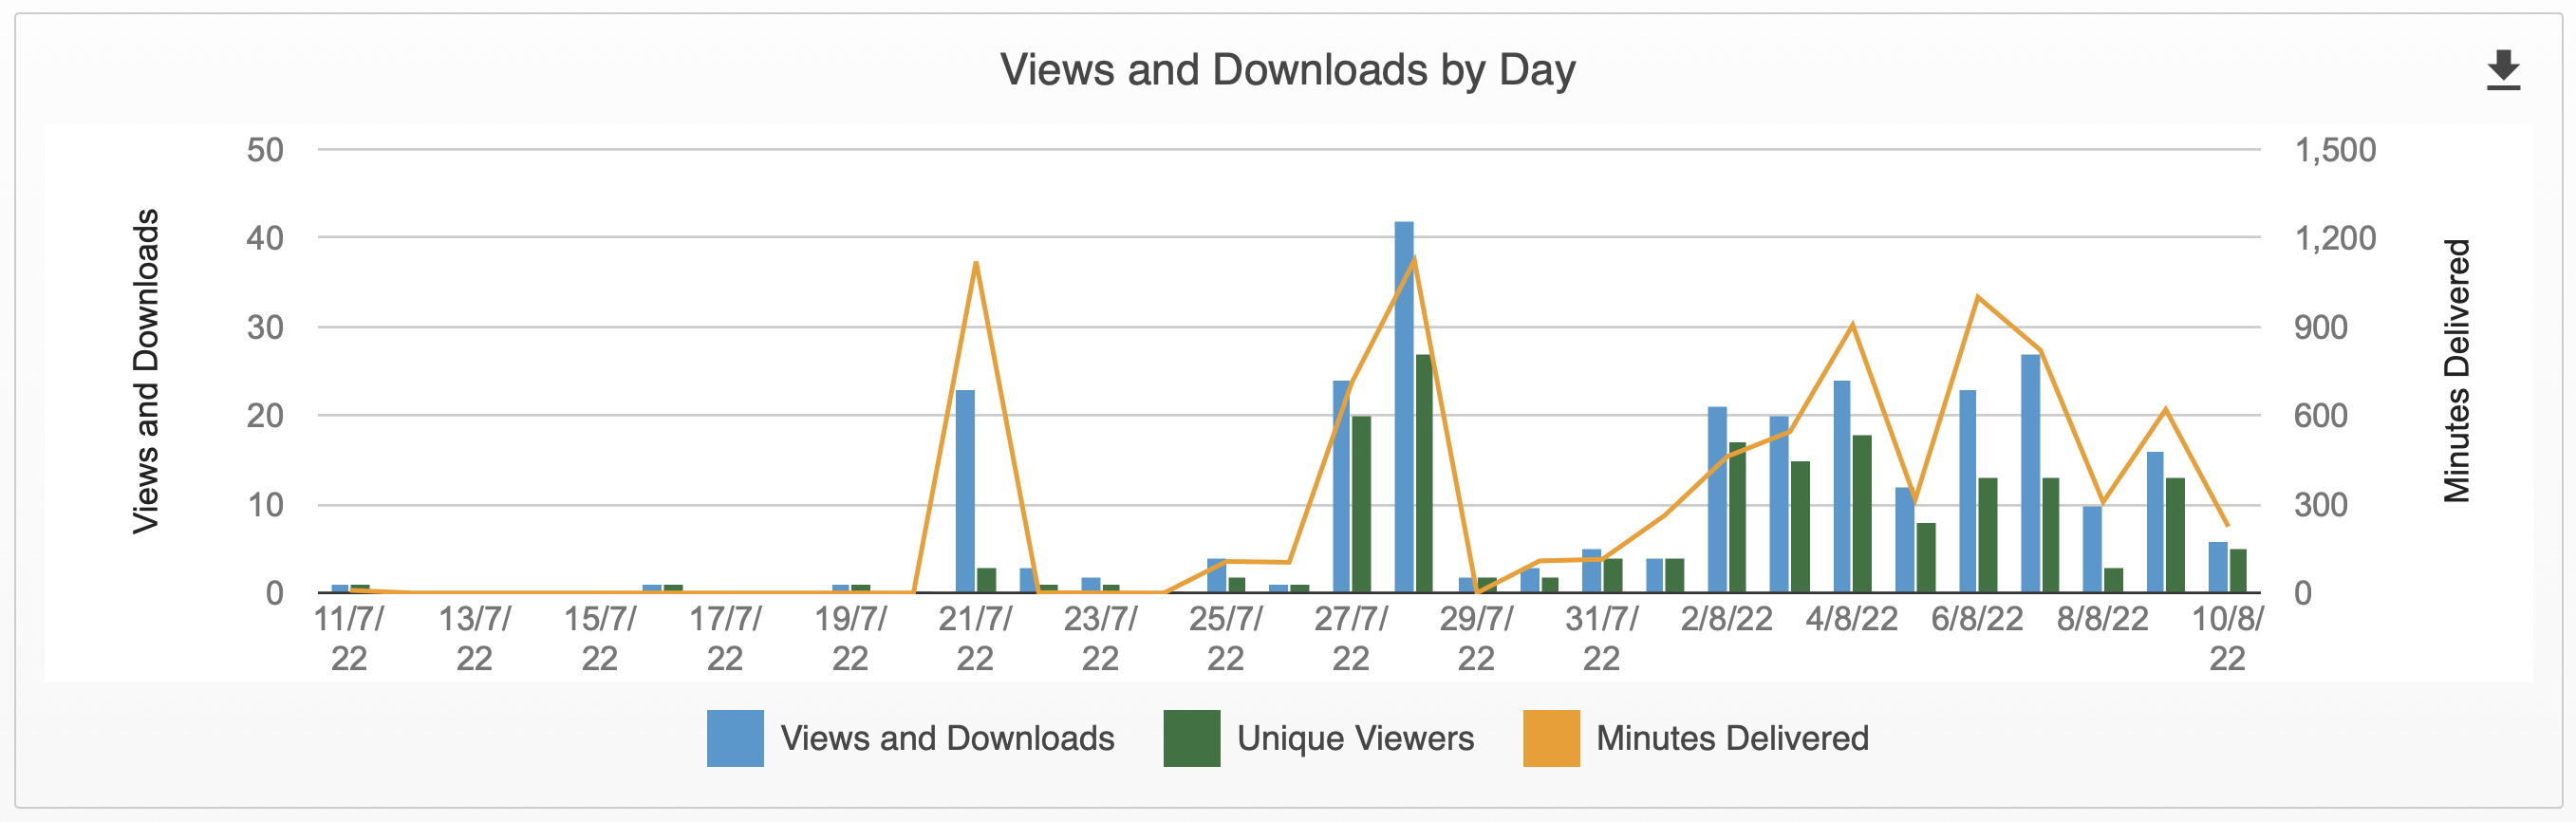
In the Views and Downloads by Day graph, you can view the number of:
- Views
- Unique visitors(viewers)
- Minutes delivered(watched)
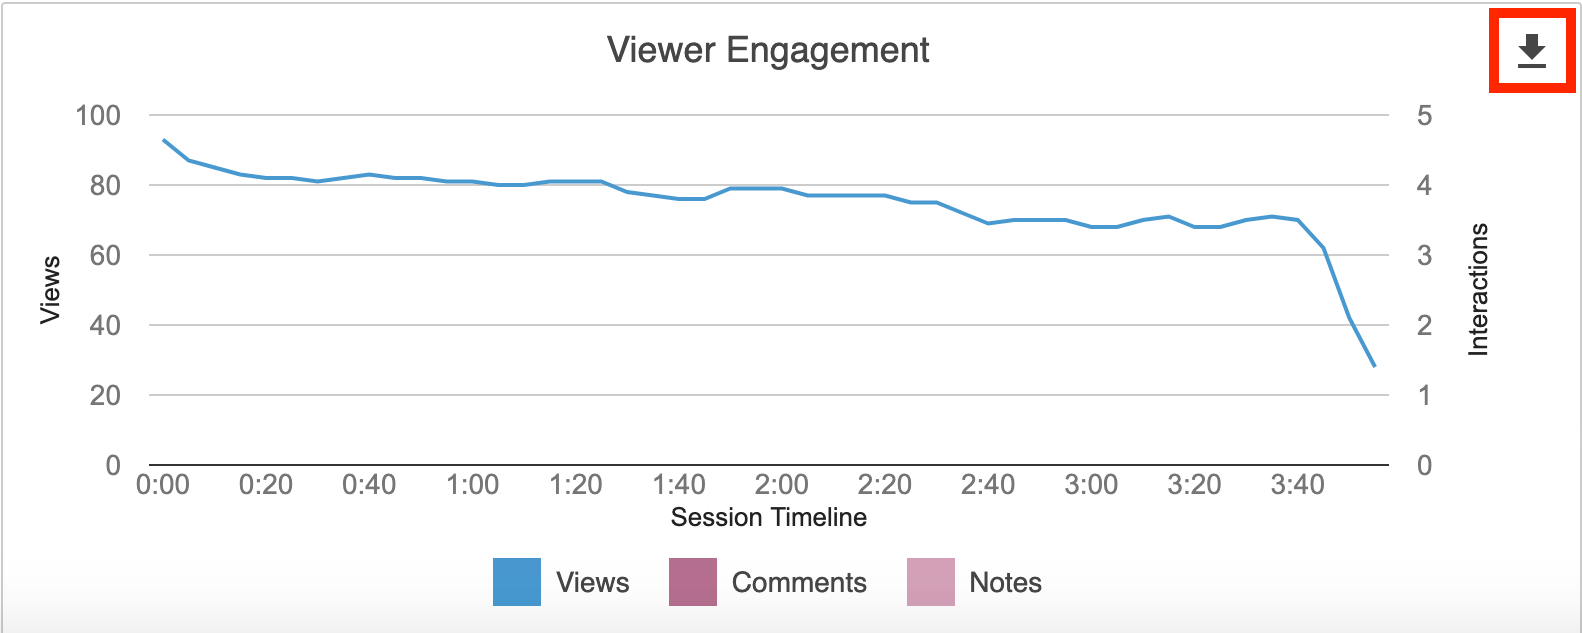
You can view the level of engagement throughout the length of the video, as well as any discussion comments or notes that have been left on the video.
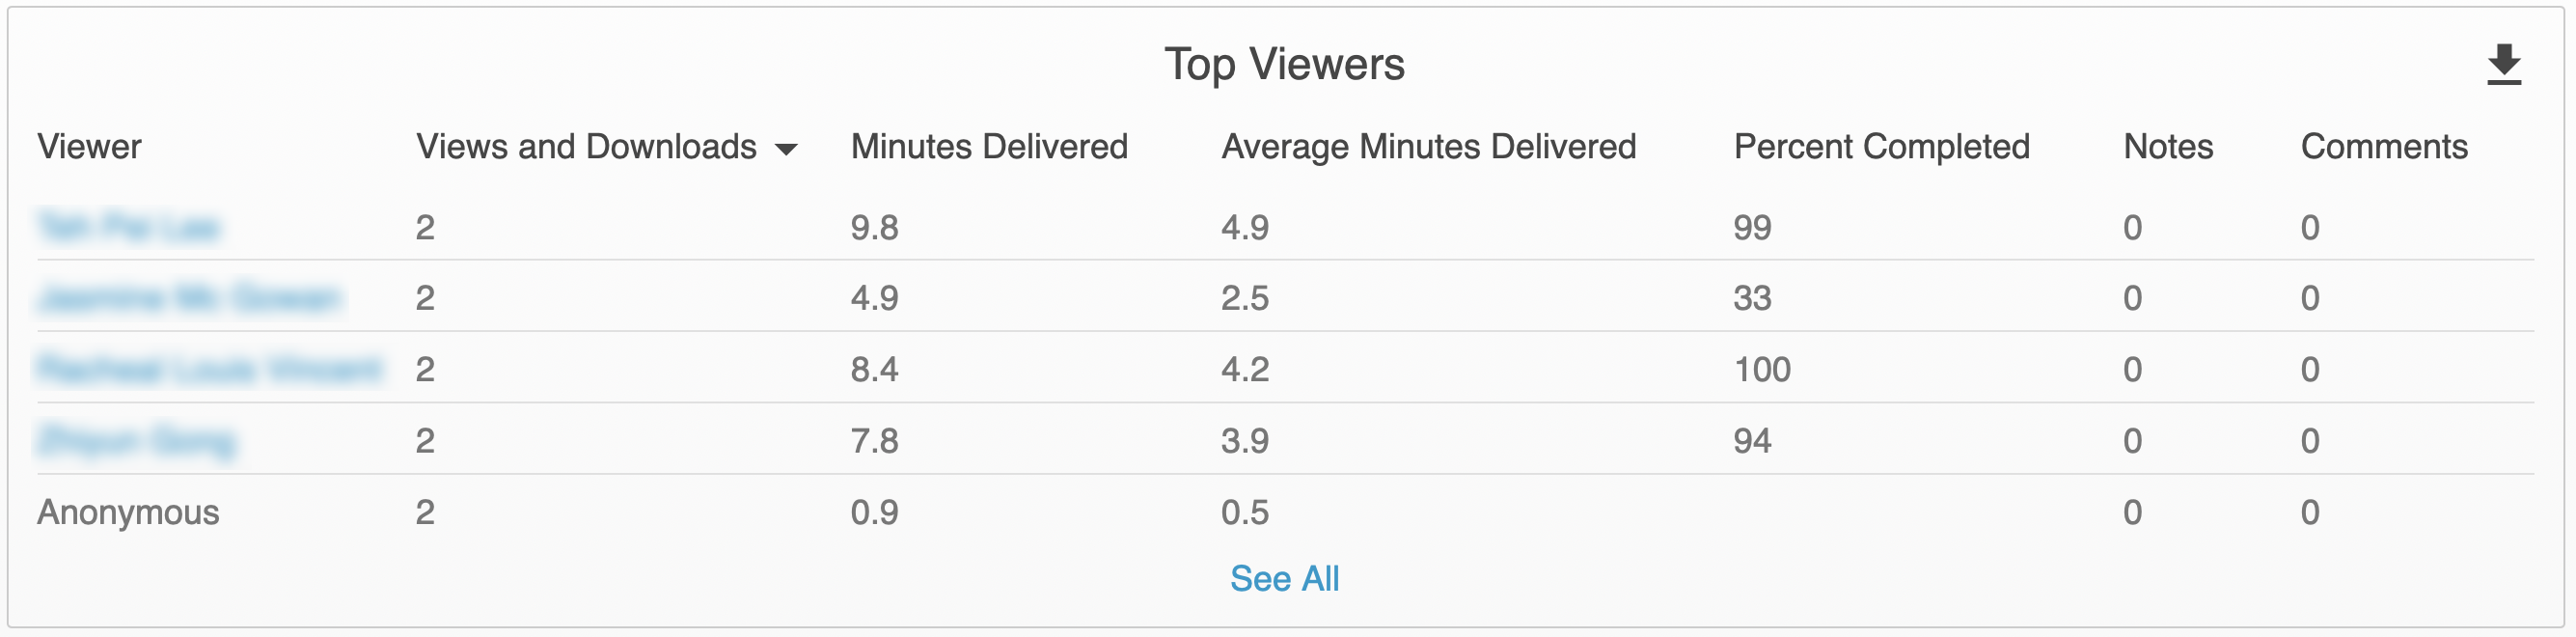
Under Top Viewers, you can view information about the top viewers which have watched the session. You will be able to see the number of Views, Minutes Delivered(watched), Avg. Minutes Delivered, Percent Completed, Notes and Comments that a viewer has made.
- Click Views in the header to sort from lowest to highest or highest to lowest.
- To expand the list and view all viewers of the session, click See All.
- Users which are not logged in will appear aggregated as Anonymous. Unique users will have their name displayed.
You can click on their name to see data about the sessions they have viewed. For more information, see View Individual User statistics.
In Download reports, you can click the links to download the report for:
- Views by Day
- Viewer Engagement
- Top Viewers
View Panopto folder statistics
- Navigate to the Panopto folder you want to view statistics.
- Click on the Stats icon in the top right corner of the screen.
- The Folder Dashboard will open in a new window, which displays a range of statistics. By default, statistics from the Last 30 days will be displayed. You can use the dropdown list to view statistics from the Last 7 days, Last 90 days, Any Time or a custom time rage.
- Click through the tabs below to learn more about each graph.
For all videos inside the folder(including subfolders) you can view the total number of:
- Views
- Unique visitors(viewers)
- Minutes delivered(watched)

If you have set up subfolders within your folder, under Subfolder Roll-up, you can view a breakdown of Views and Minutes delivered(Minutes watched) across all subfolders.
Use the dropdown list to switch between Views and Downloads and Minutes delivered. You can hover over the graph visualisation for exact figures and subfolder highlights.

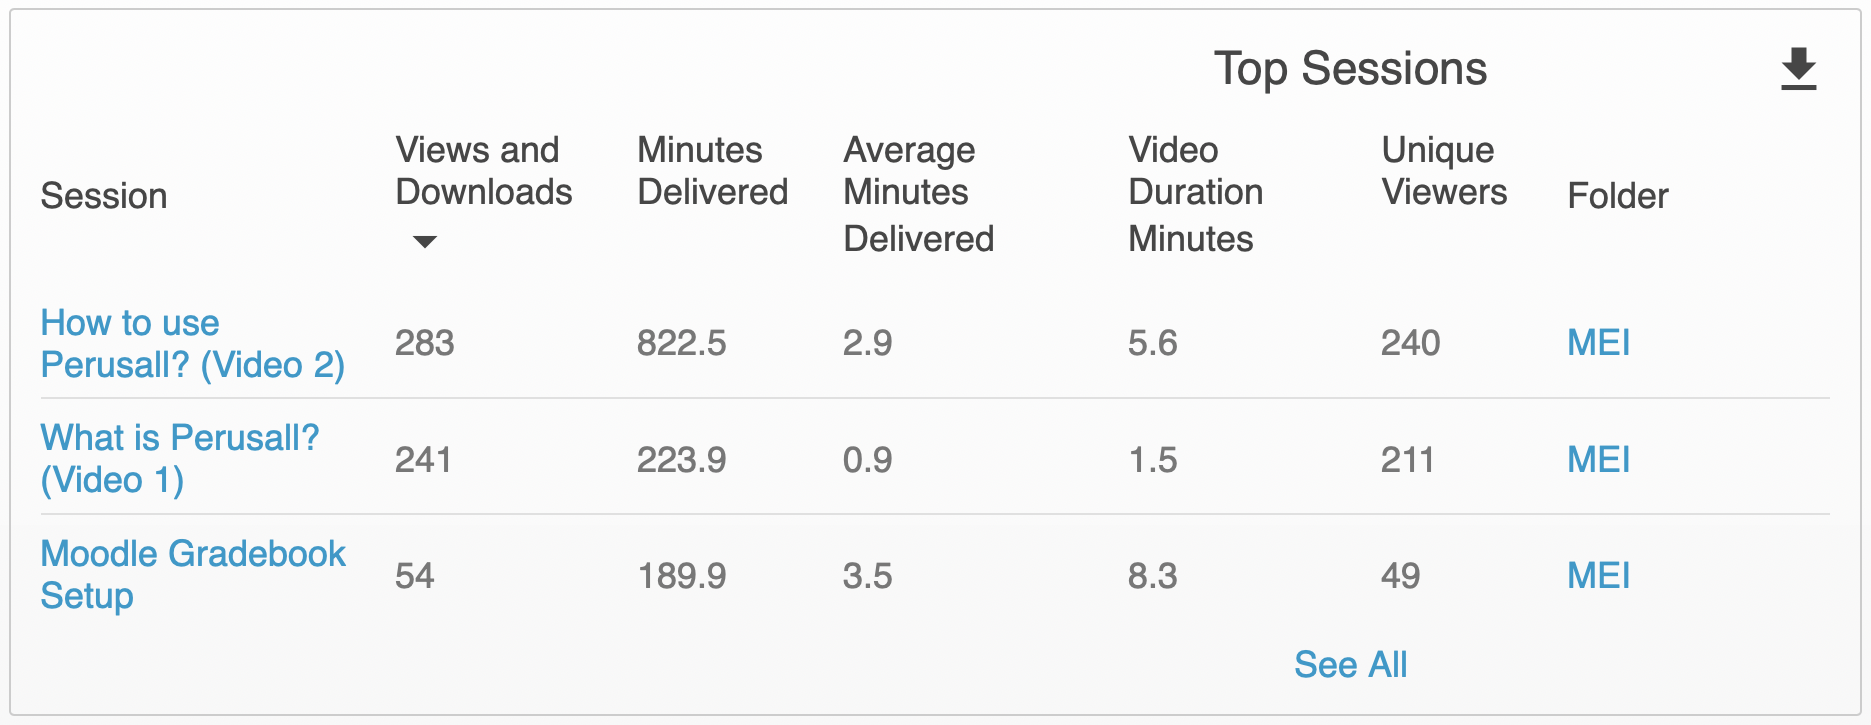
Under Top Sessions, you can view information about the top videos which have been watched within a folder. You will be able to see the:
- Number of Views
- Minutes Delivered(watched)
- Average minutes viewed
- Number of unique visitors
- Information about the folder the video sits under and top-level folder(if applicable)
- The creator of the video.
You can click Views in the header to sort from lowest to highest or highest to lowest. To expand the list and view all videos within the folder, click See All.

In Download reports, you can click the links to download the report for:
- Views and Downloads by Day
- Top Viewers
- User Completion
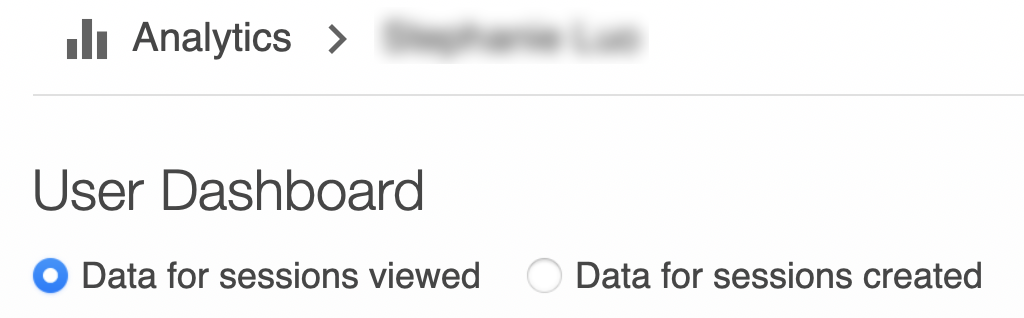
View Individual User statistics
From the Top Viewers graph, you can click on the name of a viewer or a creator to view information about their individual user statistics. You can toggle between the User Dashboard and the Creator Dashboard with the radio buttons at the top of the Analytics page.
Click through the tabs below to learn more about each graph.
- Views and Downloads by Day
- Top Sessions Viewed by User
- Top Sessions (Created by User)
- Download reports
In the Views and Downloads by Day graph, you can view the number of:
- Views
- Unique visitors(viewers)
- Minutes delivered(watched)
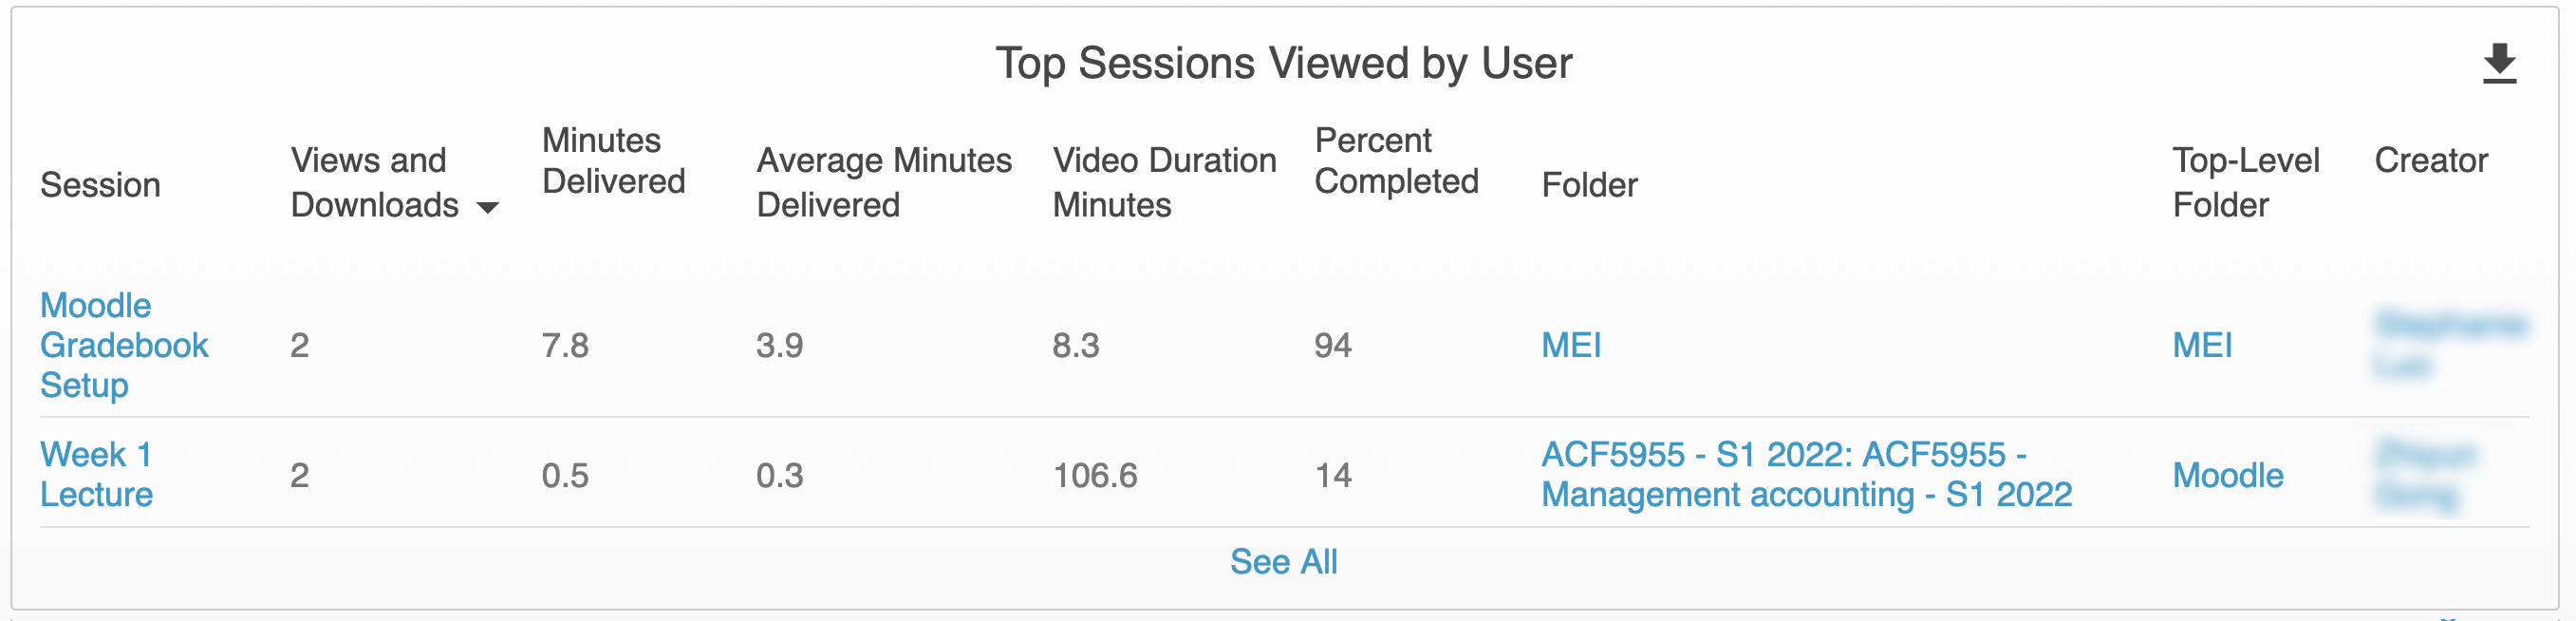
In Top Sessions Viewed by User (User Dashboard), in order of the most to least watched session, you can view:
- The name of the sessions viewed
- Number of views per session
- Minutes delivered(watched)
- Average minutes viewed
- Percentage of the video completed
- The folder the video sits under and top-level folder(if applicable), as well as the creator of the video.
In Top Sessions (Creator Dashboard), in order of the most viewed to least viewed, you can view information about sessions that the user has created, including:
- The name of the sessions
- Number of views and download per session
- Minutes delivered (watched)
- Average minutes viewed
- Video length
- Number of unique viewers
- The folder the video sits under and top-level folder(if applicable).
In Download reports, you can click the links to download the report for:
- Views and Downloads by Day
- Top Sessions Viewed by User (User Dashboard)
- Top Viewers (Creator dashboard)
In Download reports, you can click the links to download the report for:
- Views and Downloads by Day
- Top Sessions Viewed by User