Student Performance Report
| Access to Board of Examiner reports is restricted to BOE Chair, Faculty Associate Dean Education, Head of Department/School and Faculty Professional Staff. |
|---|
This report provides a view of student results in a unit for a teaching period, including the ability to filter to a school/department or a course level listing of students. The report enables a comparison of performance of students across all units they attempted in a given teaching period, including ability to reference the student WAM. This report also provides the opportunity to identify students requiring additional support as required.
Access report (authorised users only)
To request access, complete the following form: Request access to Power BI Results Management Reports.
The following instructions will guide you through all pages in this report.
Home page
The home page of the Student Performance report features the report title, description and contact point for feedback and enquiries. It is the first page that displays by default for this report. Also referenced on this page is the last report refresh date timestamp. The report is refreshed once daily.
To navigate to different pages of the report, use the Pages panel on the left hand side of the report. The current page you are viewing is highlighted in the list of pages.
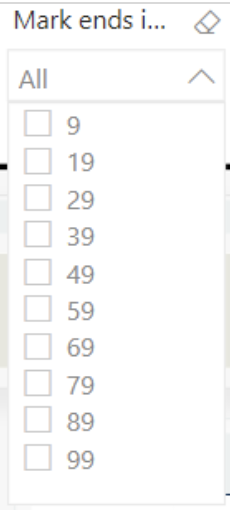
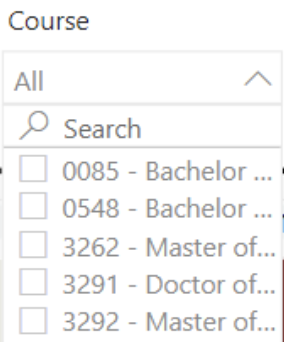
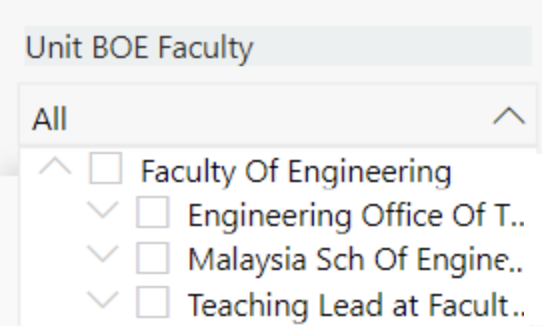
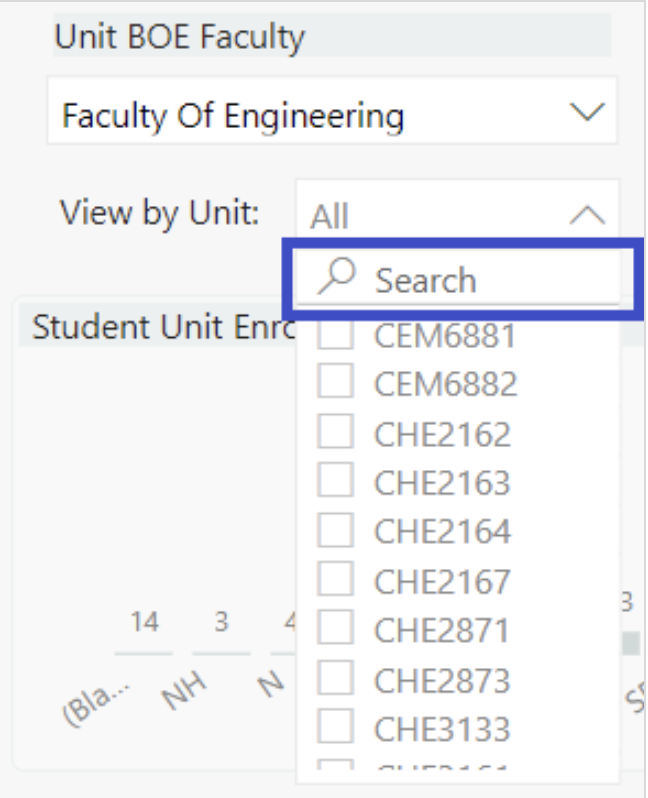
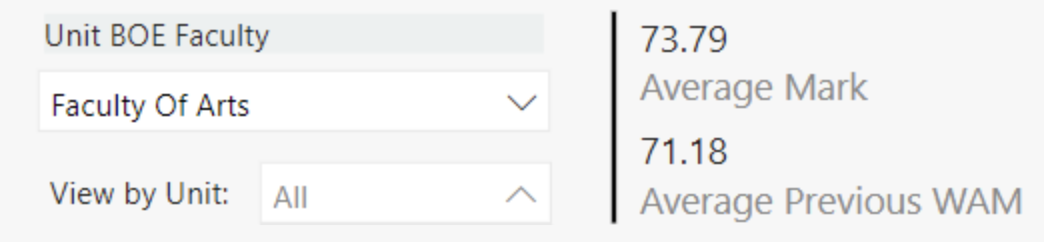
Student Performance report global filters
The Student Performance report features a set of filters that are visible at the top of the page and are applicable to all report pages. These filters persist as you navigate between report pages. If you close the report browser window and navigate back to the report in a new browser window, these filters are set to default again (i.e. your filter settings are not retained).

These report filters are as follows:
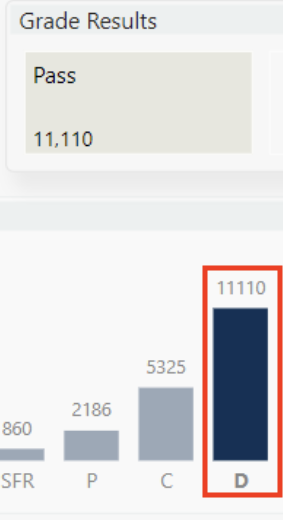
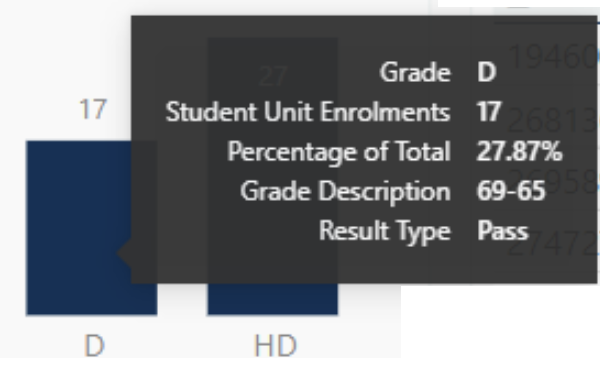
Student Performance page
There are a number of key features in the Student Performance page interface. The central visual on this page is a table listing of student results within a faculty. The results you can view in this table are determined as per your level of access enabled within this report (either you can view data for your entire faculty or for a specific department/school).

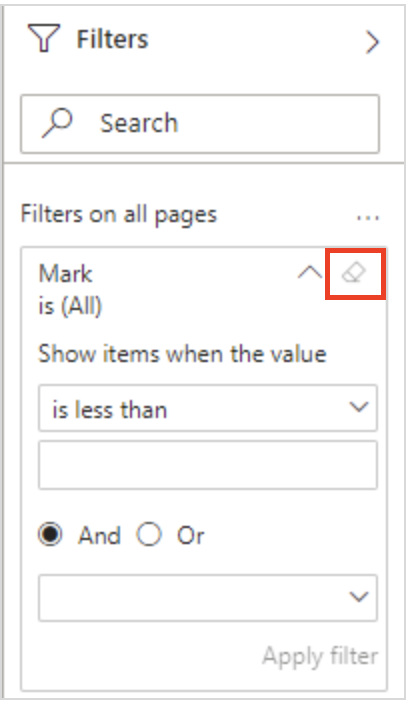
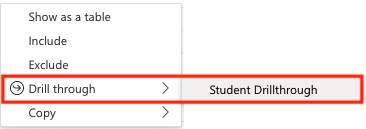
There are various ways you can filter and interact with the table as follows:
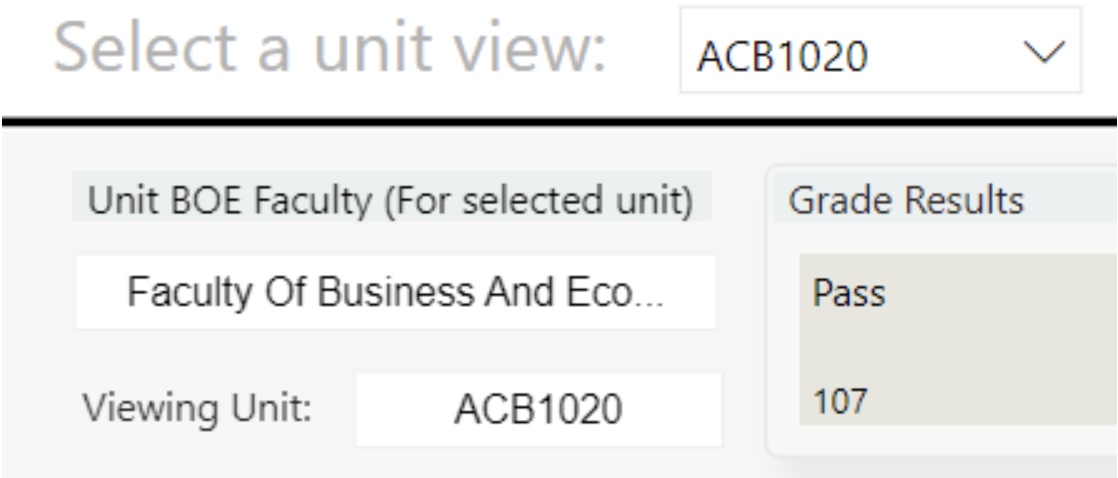
Unit View
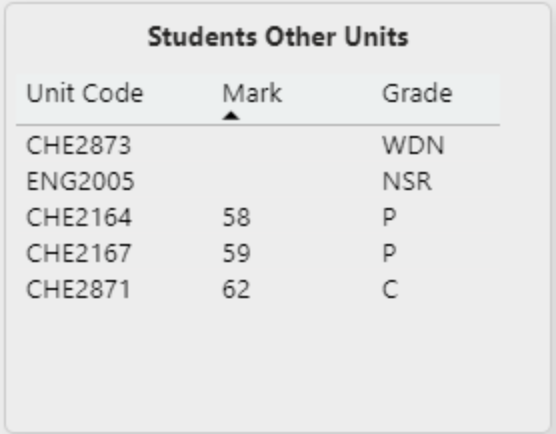
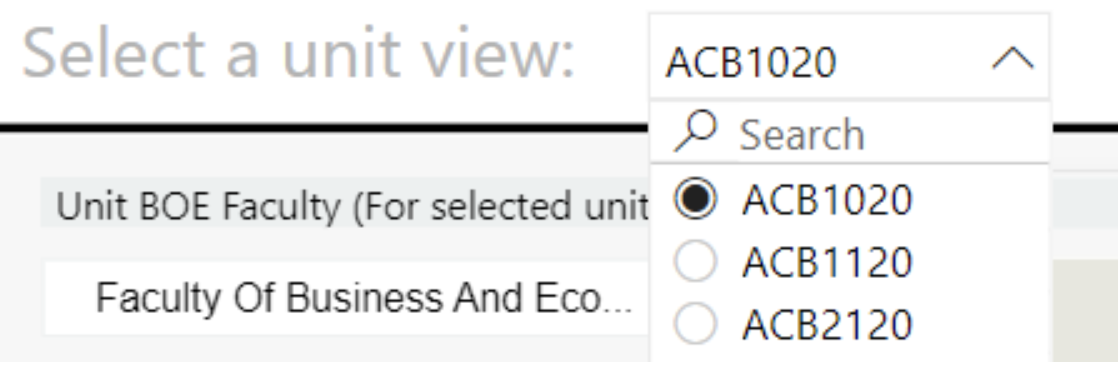
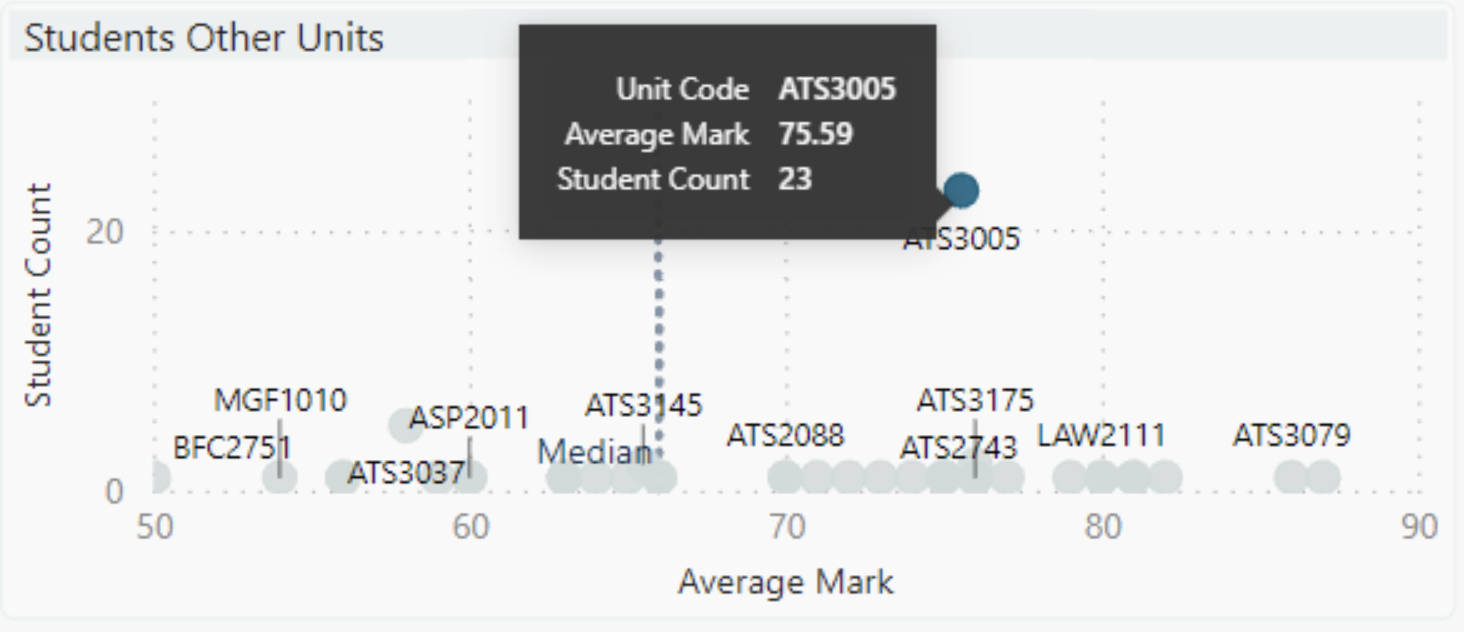
The Unit View page allows analysis of student results for a specific unit in an assessment calendar/year. The student results for that unit offering are displayed alongside any other unit results the student achieved in the same assessment calendar/year.
There are a number of key features in the Unit View page interface. The central visual on this page is a table listing of student results for the selected unit. The results you can view in this table are determined as per your level of access enabled within this report (either you can view data for your entire faculty or for a specific department/school).
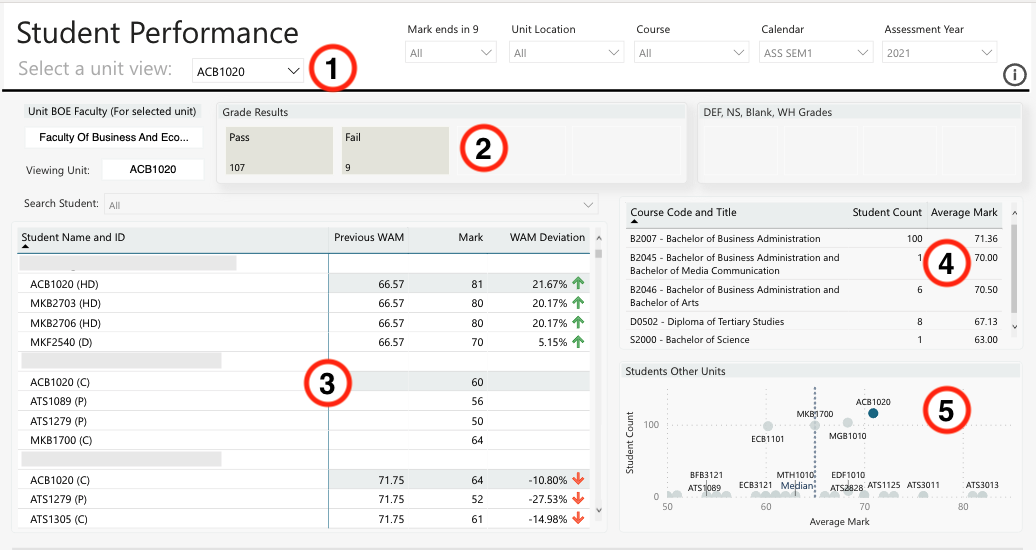
There are various ways you can filter and interact with the table as follows:
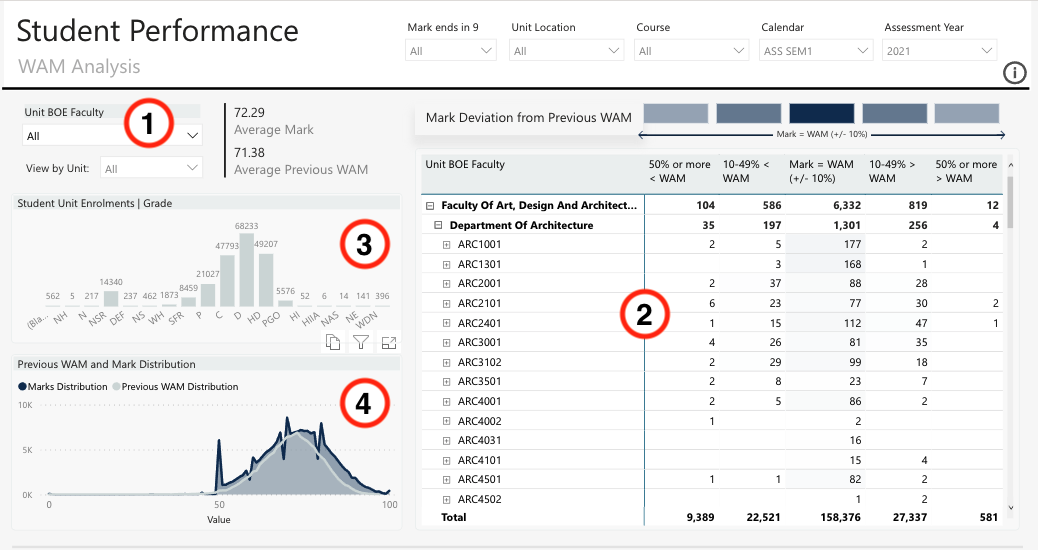
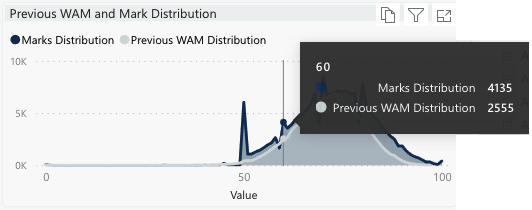
WAM analysis
The WAM analysis page enables a view of performance by mark deviation from the WAM for a specific unit, group of units, department/school or faculty. The deviation from WAM is grouped into 5 ranges of mark deviation from WAM. This page in the report enables a visual comparison of unit performance within a department/school or faculty, identifying skewing of data at either end of mark deviation from WAM range.
The central visual on this page is a table listing of units within a faculty. The results you can view in this table are determined as per your level of access enabled within this report (either you can view data for your entire faculty or for a specific department/school).

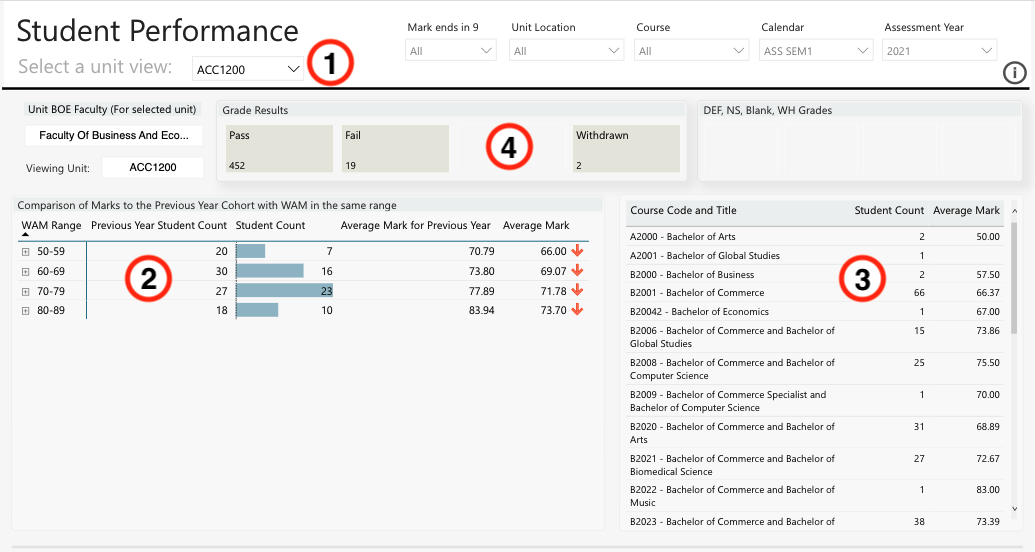
Previous Cohort Analysis
The Previous Cohort analysis page enables a comparison of average mark achieved in a unit to the previous year cohort. Students with a WAM in the same range are grouped together and their average mark is compared. The table enables you to view if the average mark is trending toward being lower than the previous cohort of students and results presented may prompt further analysis and enquiry into a particular unit.
The central visual on this page is a table that compares marks to the previous year cohort with WAM in the same range for a selected unit. The results you can view in this table are determined as per your level of access enabled within this report (either you can view data for your entire faculty or for a specific department/school).